
ANTS Memory Profiler
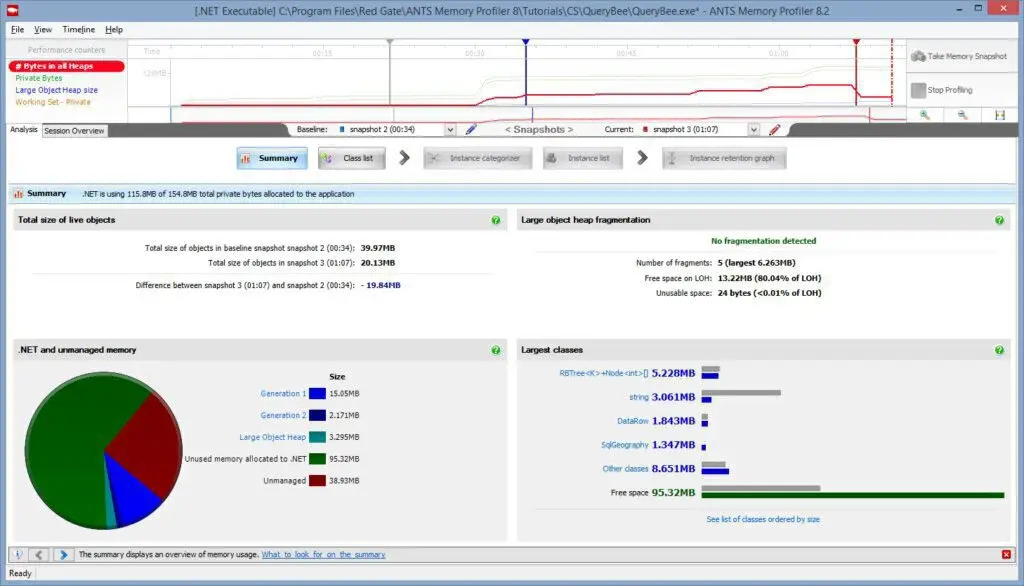
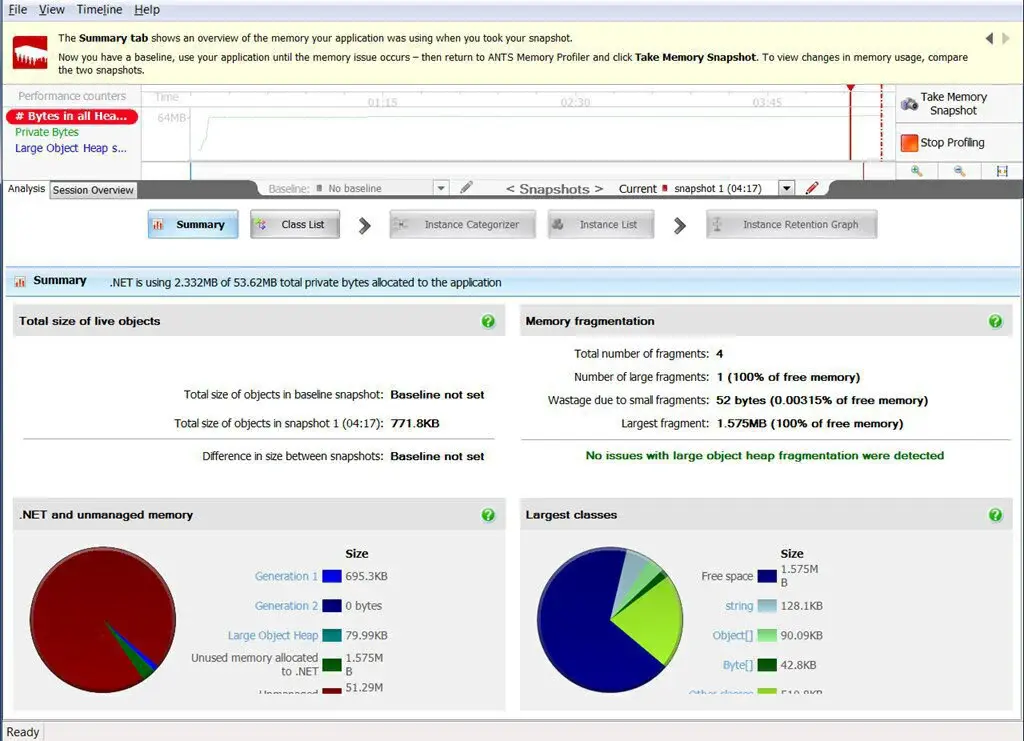
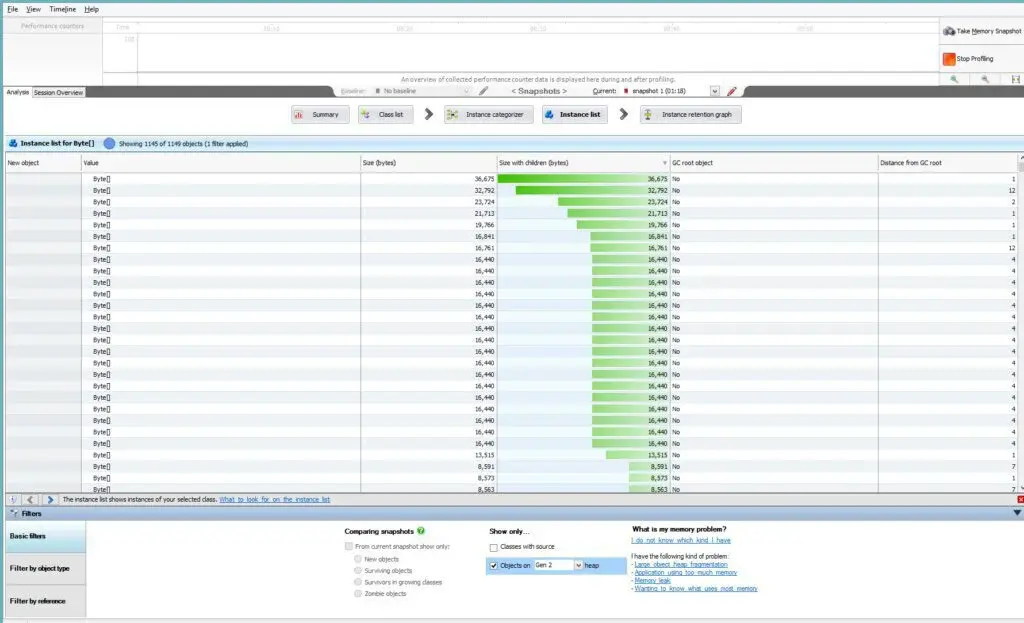
ANTS Memory Profiler is a memory profiling tool that optimizes the memory usage of an application, locate down the memory loses and identifies the root causes of complicated memory problems. This tool helps the user to find out which parts of the code take the most time and resources.
The key features of this platform are diverse, and a user can obtain clear and meaningful results. The faster results give the instant visualization of the relationship between the objects and save hours of problem-hunting. It also offers to debug the applications that are web-based through a systematic approach to finding the memory leak.
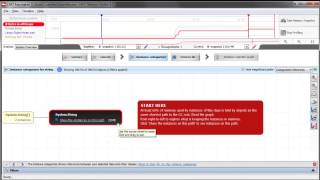
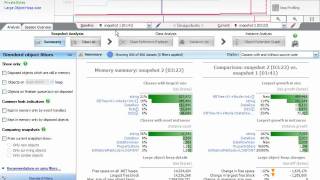
The platform’s unparalleled performance and capabilities are far superior to other tools. ANTS Memory Profiler can analyze a large number of memory snapshots and compare two or more snapshots. It is easy to use as it shows the user from where to start and makes the interpretation easy.
ANTS Memory Profiler Alternatives
#1 AppTimer
AppTime is free software that determines the time taken by another app to launch, also known as the start-up-time. This platform can compare the performance and time of different products on the same or different hardware.
AppTimer calculates the launch time of a file by running it several times and keeps the results of all those tests in a log form. The user can customize the app by fixing the number of tests and the usual functioning and closing of the app. This aspect of the software gives the user a set of diverse options to do the tests.
This software has a plus point, as the user does not have to install it like other apps. Users only have to download it, extract the .exe file, and run it in any program user wants to. This app has the smallest margin of error and is a great benchmarking tool for getting accurate results.
#2 YourKit Java Profiler
YourKit Java Profiler is a java profiler tool that profiles applications both at the production and development stages with a revolutionary approach. This platform is powerful and intelligent as it provides advanced, unique, and automated analysis. The user can profile any application with this profiler. The software has a CPU, memory, thread, exception, monitor, and automated profiling.
This profiler helps the user to solve the performance problems at the early stages and can enjoy massive productivity gains through advanced features of the software. Yourkit Java Profiler not only boosts productivity but also saves time through higher efficiency.
YourKit Java Profiler provides both local and remote profiling along with features for memory usage and memory leaks. The software has an easy installation, configuration, and profiling process. The CPU profiling feature of the software focuses on profiling specific areas of the code as desired. The user can profile both SQL, and NoSQL database calls with this software.
#3 JConsole
JConsole is a graphical tool that allows users to manage and monitor Java applications by connecting to a remote java application. Thus the software enables the user to monitor local applications running on the same system and gives a further benefit of monitoring those apps that are running on remote systems.
JConsole has a simple user-interface and has easy access to the most common JVM metrics. Through JVM, information on resource consumption and performance of the apps is provided by the software. This platform is also used to alter several patterns dynamically in the running system.
Two kinds of memory, such as memory-heap and non-heap memory- are managed by JVM in the software. The software comes with a Java Development Kit, and the interface has different tabs like summary, memory, threads, classes, etc. and a plugin API. Moreover, the software also allows the user to display a chart of different attribute’s values.
#4 Robot Console

Robot Console is an automatic management and log monitoring solution for IBM i that delivers the automatic messages of related information. The tool is a fully customizable and automated solution that provides only the IBM messages you need to see. Robot Console deals with the messages automatically when the system gets any critical message.
It supports built-in scripting language with operators to handle the complex process and allows you to create procedures to check the message variable for the sake of decision processing. It has OPAL, which gives the facility to automate complex situations and check the message content to decide the actions.
The core features of Robot Console includes monitor business-critical applications, create custom message text, prevent incorrect message response, escalate critical messages, and many more. The solution gives a response to the news with the help of mobile devices and centralizes the message management efficiently.
Additional features of Robot Console are Network-wide control, Manage system logs effortlessly, Monitor application logs in the IFS, and Monitor IBM Resources proactively. It can work in tandem with a robot alert that sends messages through emails.
#5 Valgrind

Valgrind is a set of tool that handles the memory management, profile detail programs, and threading of bugs as well. It is an instrumentation platform to build an analysis tool dynamically. It allows you to develop new tools and detects the errors in form memory with ease. It saves the time of debugging and speed up the programs to increase efficiency and productivity.
It is compatible with the various platforms such as PPC32/Linux, x68, and AMD64 Linux and works with the many Linux distributors. The solution includes many profiling and debugging tools such as Experimental tools, Memcheck, Callgrind, Massif, and many more. These tools support to allow you to access memory, used the uninitialized values in dangerous situations, leak memory, and free of heap blocks.
It can report the bugs with the help of the Bugzilla report page by creating a KDE Bugzilla account. It is an open-source platform and supports C and C++ languages with the GPL license type.
The core features of Valgrind include Helgirnd, Valgrind’s tool suite, Cachegrind, and many more. It makes your program more correct and faster and prevents you from unpredictable behavior & crashes. It is a free tool having multiple features with the availability of the download button.
#6 dotMemory

dotMemory is an online and advanced .NET memory profiler that enables you to analyze the usage of memory in different .NET and core applications such as ASP.NET web applications, .NET processes, windows, and desktop application and many more. The tool provides the facility of a timeline view that can monitor the memory consumed in real-time by your application.
The tool can collect the profiling data by taking the snapshot with a single click without stopping the session of your profiling. It adds your snapshots to browse memory traffic or compares it in a specific time. It supports many powerful and robust ready-made inspections that can find common memory issues with single clicks without any formal activity.
One of the core features of the tool includes analysis more profound facility that offers multiple options to apply on the memory usage data and allows you to view and track the data from different angles, drill down, slice, etc. It has a secure and straightforward interface that determines the traffic in a particular time-frame to handle the garbage collections and excessive allocations with ease.
There are many prominent features of dotMemory such as visual studio integration for the sake of profile unit tests, .NET memory unit to check all kinds of codes, multiple views on data to know the insights, automatic inspections for common memory issues, and many more. dotMemory offers five days free trial with a secure download as well as a buying facility.
#7 VisualVM

VisualVM is a visual integrating tool that includes several command-line JDK and lightweight-profiling as well. The tool can troubleshoot and monitor the applications that are running on Java 1.4 or higher form various vendors with the help of multiple technologies such as serviceability agents, attach API, and JVM stats. It is compatible with the web-based platforms and the source of VisualVM available on the GitHub.
It can detect the remotely running Java applications and locally lists automatically and define the applications by JMX connections manually. The solution provides an easy and straightforward interface to monitors the application permanent generation memory, CPU usage & GC activity, met space and heap as well.
It has a timeline features that display all threads running in the process of java with monitoring time, aggregated running, sleeping, and wait for procedures. One of the core features of VisualVM includes profile performance and memory usage that holds the profiling capabilities to analyze the memory management and execution of applications.
The solution can display thread dumps that is going in the process of targeting and help you to find distributed deadlocks efficiently. It allows you to create and view the memory snapshots such as .hprof, which handles debugging memory leaks and inefficient heap usage. It offers multiple plugins for an application like experimental and third party plugin with security.
#8 JProfiler

JProfiler is an intuitive all-in-one java profiler that resolves the threading issues, pin down memory leaks and performance bottlenecks with ease. It has several probes that provide the higher-level data by using the subsystem of JRE, and it’s Java EE subsystems also show the high-level information regarding sockets & processes, RMI calls, and files.
It can find the memory leaks with an intuitive interface that solves the entire complex issues with five different views and gives the essential insights to objects. The tool consists of extensive QA capabilities that is suitable for development and also for the QA team with the support of common line operations.
There are many prominent features of JProfiler, such as broadest support for platform application service and ides, database profiling for NOSQL/JDBC or JPA, extensive support for java enterprises edition, Integrated thread profiler to tackle too much looking, and many more. The tool supports profiling on many platforms such as Windows, Linux, macOS, and HP-UX.
Additional features of the tool are Snapshot comparisons, Viewing an HPROF snapshot, Live profiling of a remote session, easy creation of custom probes, and more.
#9 RIPS

RIPS is a platform that helps developers in security testing of static applications with languages such as PHP, Java, and others. It helps the developers in finding the complex vulnerabilities which are missed by other testing platforms. Moreover, it provides a very low false-positive rate and offers accurate results.
The platform enables the developers to run it both on-premise or as SaaS, and users can scan their code on it. Moreover, it also allows the developers to integrated RIPS into their development tools to automate their testing and tracking the vulnerability. Developers can even integrate the software into the CI/CD solutions and issue trackers and other custom tools.
RIPS allows the users to track the progress of their application from the security perspective throughout its lifecycle. It is almost forty times faster than other solutions and tracks all those critical security issues which are missed by other generic analysis solution.