
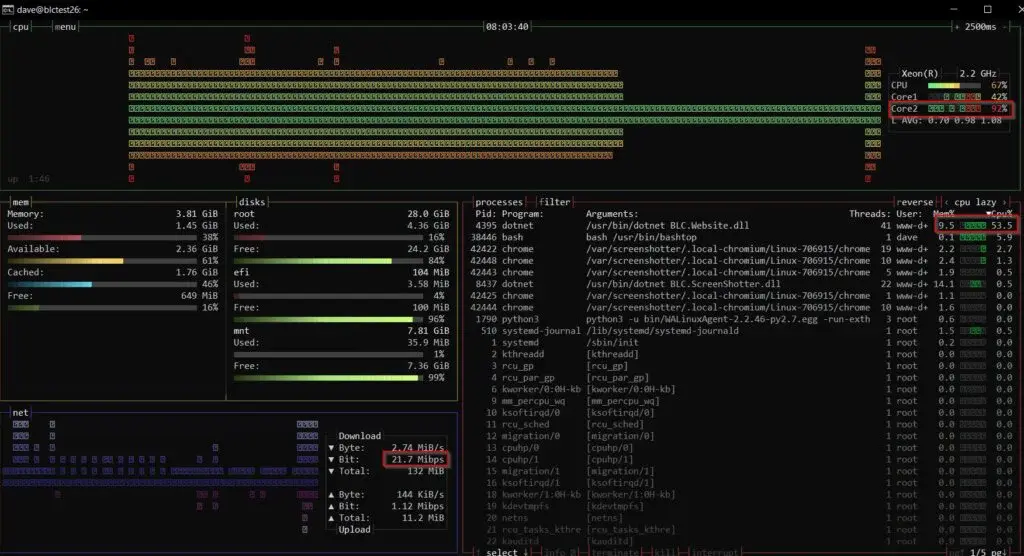
Bashtop
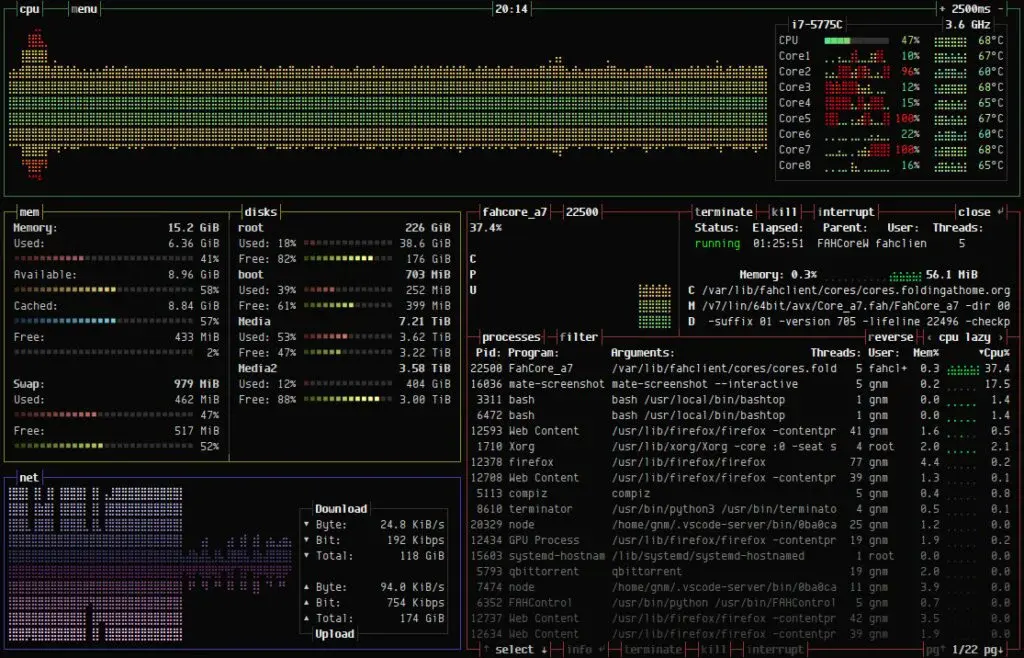
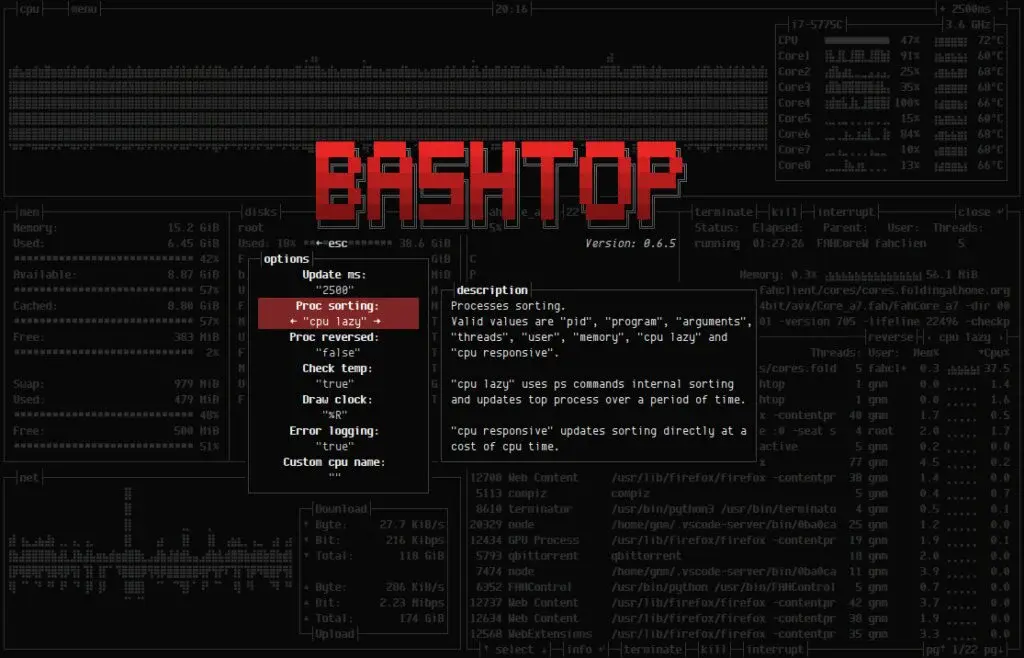
Bashtop is an open-source, feature-rich resource monitor that displays statistics about networks and processes, processors, disks, and memory. It is super-fast, easy-to-use, CPU-intensive, and provides multiple benefits such as extensive customization, mouse support, memory consumption graphs, and toggleable mini mode.
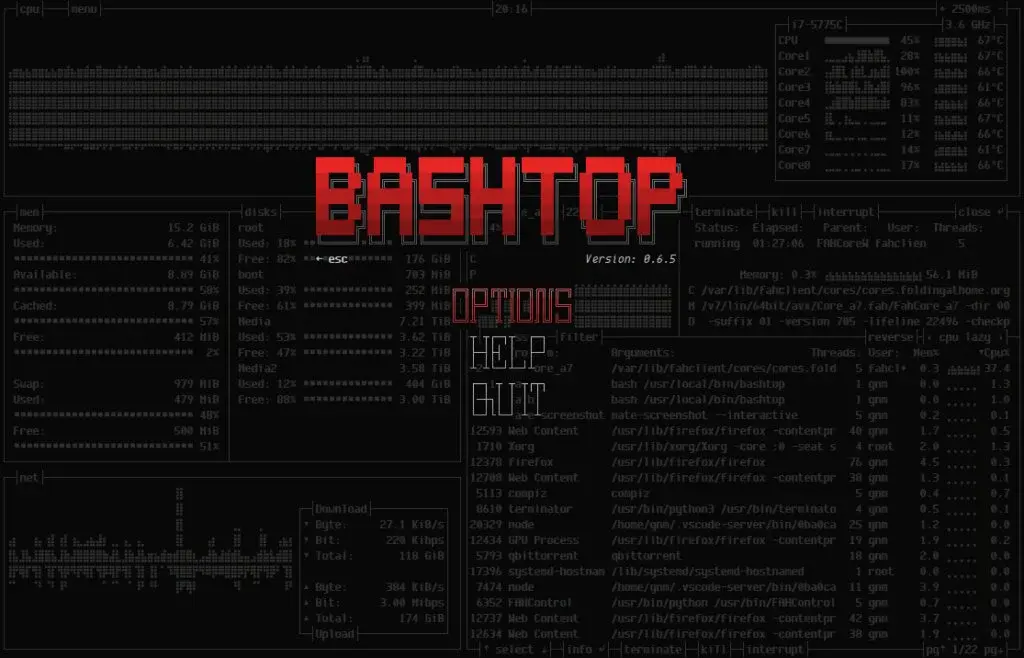
You also get access to many amazing features such as the ability to filter processes, a beautiful menu inspired by games, checking in-depth stats for the selected process, an auto-scaling graph for network usage, notifications informing about a new version, and more. It also lets you view current write and read speed for disks and send SIGINT, SIGTERM, SIGKILL to the desired processes, and more.
Bashtop Alternatives
#1 Nmon

Nmon is a Nigel performance Monitor designed for Linux and provides tools that perform with the same efficiency on nmon for AIX. It is a benchmark tool, system administrator, and tuner that provides you with a lot of essential information regarding performance in a single try. The data output can be in two ways, namely On Screen and saving data to a .csv file.
Through the On-screen mode, you can display statistics for resources, CPU, NFS, network, top processes, and more without hassle. The second method comes in handy for longer-term data capture and analysis. You can use the nmonchart, provided by the website for the generation of a Google chart webpage.
This can be used along with the nmon Analyser Microsoft Excel spreadsheet, whose functionality is to open the nmon output file and initiate the creation of several graphs automatically to enable you to read or write performance reports. You can filter the data or put it into an rrd database without restrictions. The data can be placed into an rrd or any other database of your choice for a personal analysis.
#2 Psutil

Psutil (process and system utilities) is a freeware and multi-platform library that you can use to get statistical information regarding system utilization and running processes in Python without hassle. It is compatible with several platforms such as AIX, macOS, Sun Solaris, Linux, Microsoft Windows, NetBSD, FreeBSD, and OpenBSD. Through the software, you can get a glimpse of the currents state of system utilization of the built-in hardware like sensors, CPU, network, memory, and disks. It comes in handy for the management of running processes, system monitoring, and limiting and profiling process resources. The library successfully executes many capabilities/functionalities provided by command-line tools in classic Unix, including ifconfig, ps, netstat, top, and Isof.
#3 Gtop
Gtop is an open-source and easy-to-use system monitoring dashboard for Terminal developed using JavaScript. It allows you to keep an eye on the active processes and CPU History, Memory and Swap History, Memory, and Network history. All the information is displayed on a single screen, and you can scroll through the list of processes to see each one. The requirements for running the solution include Windows, Linux, or Mac OSX, and Node.js version 8+. The installation can be completed through the npm command or Docker. Once it is installed, you can launch the solution by entering the gtop command.
#4 Iftop

Iftop is a command-line system monitor released under the General Public License and written in the C programming language. Its purpose is to provide a list of network connections to the end-user. The list is updated frequently, making it easy for you to view the latest data without hassle. It arranges the connections by bandwidth usage and only displays the “top” consumers of the bandwidth. According to the official website, the goal of iftop is to offer network usage information.
You can use it to get answers to various problems related to the network, like the reason for the poor performance of the ADSL link. The system monitor works by first listening to the network traffic on a named interface and then afterward provides you with a table showing the ongoing bandwidth usage prioritized by pair of hosts.
#5 Vtop
Vtop is an open-source and robust terminal activity monitoring tool that makes it easy for you to track memory and CPU usage. Some of the command line tools out there make it difficult to view CPU usage, but this problem is solved by vtop, and now you can easily check usage across multi-process applications.
Besides that, it clearly shows memory usage and spikes over time. The memory and CPU usage charts are drawn and shown using Unicode braille characters. The best feature is that it combines processes with similar names together. It is written in Node.js, which along with NPM, is a necessary prerequisite for installation.
#6 Atop

Atop is a useful tool for Linux server performance analysis that is designed to report and log what each server process is doing. The best feature is that it keeps running in the background and can stay that way for a maximum of 28 days to enable long-term server analysis. The benefits provided to the end-user include displaying resource usage of each and every process, even those that have been previously closed or completed, thread monitoring within processes and skipping unused processes, prioritizing crucial resources with red color, and removing or adding columns depending on the size of the display window. Another advantage is that the netatop kernel module is used to monitor network bandwidth and TCP and UDP.
#7 Iotop

Iotop (Input/Output top) is a Linux command that once executed, shows you the disk I/O usage details, making them easy to monitor. The best feature is that it also retrieves data about existing IO utilization by processes and shows them to you in a table view. The command will not work without kernel modules. It is written in Python and makes like much easier for system administrators by allowing them to track down the particular process responsible for increased disk I/O writes/reads. Before using it, you must ensure that the system has a python interpreter. The displayed output bears a striking resemblance to the top command.
#8 GNOME System Monitor

GNOME System Monitor is designed to make it easy for you to monitor system resources and manage existing processes. It offers many benefits to the end-user, such as searching for open files, monitoring memory, network and swap, and memory usage, viewing the mounts and disks for used and available space, and tracking the control processes and process properties. The UI is user-friendly and includes three buttons at the top for Processes, Resources, and File Systems, with the information given below depending on the clicked button. Other options include search and the settings button.
#9 PySimpleSOAP

PySimpleSOAP (Python Simple Soap Library) is an open-source and easy-to-use library developed for client and server web services interfaces with the goal to be non-complex and easy to manage while providing the required functionality. The developers modeled it after PHP Soap Extension and also added the same functionality, and with the passage of time, other advanced features were implemented. The library has many aims, and these include Lightweight, Backwards compatible, Simple, Flexible, Pythonic, Dynamic, Easy, Extensible, and WSGI compliant. PySimpleSOAP supports Python 3.
#10 Libstatgrab
Libstatgrab is a library developed using C to provide cross-platform access to information regarding the system on which it exists. It offers several interfaces for accessing important system statistics. You can view core details like disk I/O, CPU usage, network traffic, memory utilization, process counts, and more. The library is compatible with multiple platforms such as AIX, FreeBSD, Solaris, Linux, HP-UX, NetBSD, and more.
Besides the mentioned features, you will also find a few useful tools in the package. One of these is saidar, which allows you to view the existing system state through a curse-based interface. Another great tool is statgrab, responsible for providing a sysctl-style interface to information collected by libstagrab. This functionality can prove useful for anyone writing scripts or anything else for which it is difficult to initiate C function calls. Statgrab is bundled with a script that you can use to generate an MRTG configuration file for using statgrab.
#11 IPtraf-ng
IPtraf-ng is a Linux network monitoring program useful for viewing statistics about IP traffic. You can use it to view crucial information like Lan station statistics, Current TCP connections, Interface activity, Packet counts by packet sizes, Flag statuses on TCP packets, TCP/UDP counts by ports, Byte and packet counts by IP address, and more. It is an excellent tool for finding the type of traffic running on your network, along with the service and the machine on which it is being used. It works on a number of interfaces, including loopback, Ethernet, and PLIP. It supports various tunnels such as SIT and GRE-over-IP tunnels.