
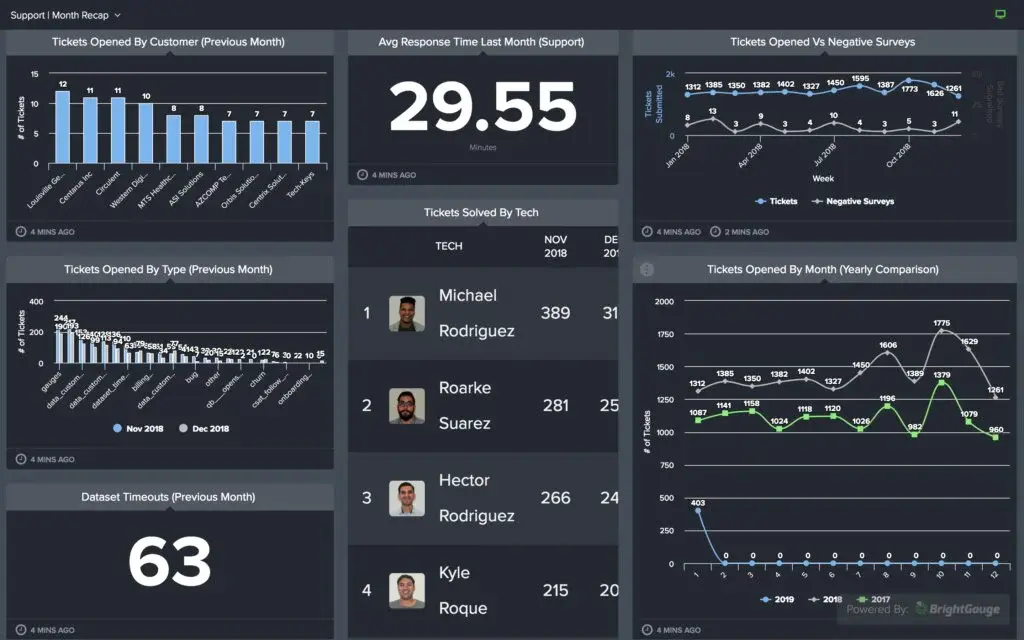
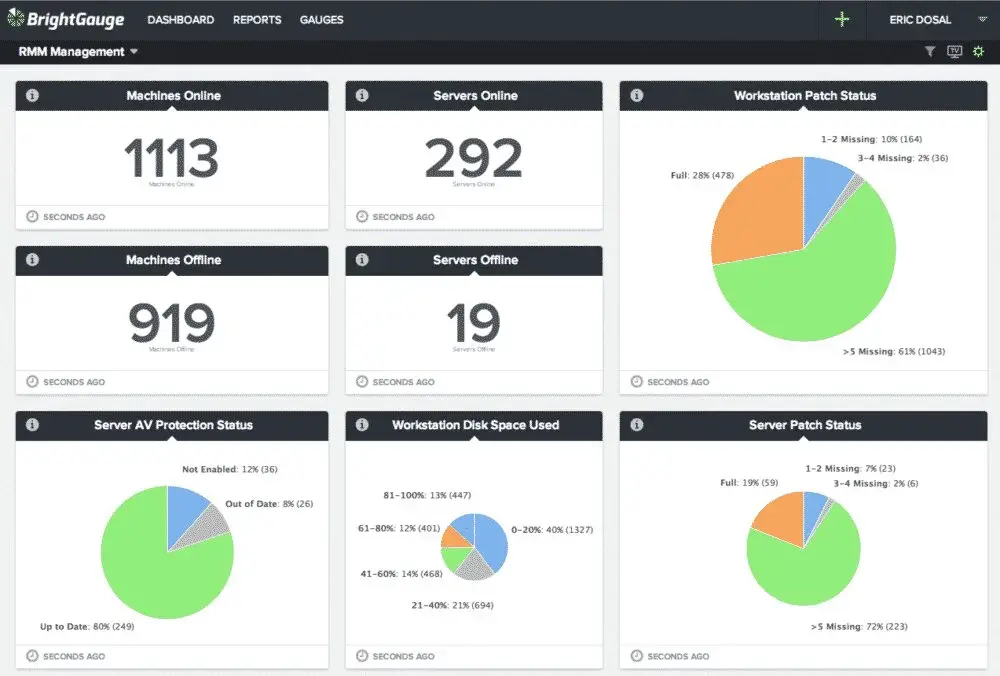
BrightGauge
BrightGauge is the easiest way to track and analyze business data. It lets you discover timely insights and actionable information relevant to a range of business scenarios, from finance and marketing to risk management and compliance. The powerful analytics software enhances your data with presentation-ready charts, graphs, and dashboards. This analytics platform helps business leaders make better data-driven decisions and increase the effectiveness of their teams.
In addition to advancing current workspaces, it also leverages its fully integrated capabilities to help customers create new ones. From embedding public or private APIs into a single hub to developing custom workflows with intelligent automation, everything it does is built around helping your team work smarter. The core features are multiple data sources, public dashboards, calculated metrics, detailed reports, personalized training, data source mashup, client reporting, goal management, and more to add.

BrightGauge Alternatives
#1 Tableau Public

Tableau Public is a best-in-class data visualization software that makes your data-driven stories instantly shareable with the world. You can write, publish and share instantly online through a variety of social channels or embedded in your website. Or you can download your story to Tableau Public and deploy it as an interactive web workbook or an interactive PDF. Tableau’s mission is to help people see and understand their data.
It believes that anyone should be able to easily extract value from their data and turn it into information—and that information can be shared and analyzed through a community of people, departments, and systems. It makes business intelligence software that helps people see and understand data. Businesses use it to gain insight, organize their data, and influence their organizations. It helps anyone, from business professionals to data science teams, analyzes and visualize data.
#2 KiniMetrix

KiniMetrix is launching a new product that enables Business Intelligence professionals to visualize their data with interactive dashboards. It helps business intelligence professionals create and share interactive data visualization dashboards to tell their stories and enable insights at any time, on any device, and to anyone. KiniMetrix supports allowing businesses to quickly create dashboards with visualizations relevant to their business.
KiniMetrix offers many built-in features that are designed to simplify the process of creating reports and improving their overall quality. Templates include built-in recommendations on the best way to visualize the data and incorporate it into the report. They come with options that make it easy to design reports that include titles, logos, company branding, charts, maps, and more. The software also has built-in tools for controlling layout aspects of reports, such as alignment of text, the highlight of important information, and paragraph formatting. It facilitates you with things like ad hoc reporting, performance reporting, predictive analytics, profitability analysis, and more to add.
#3 Datamatic.io

Datamatic.io is a data visualization and business analytics software that allows users to instantly create dashboards with one click. It is making sense of the data available to your business and helping you make informed decisions. It comes with extravagant content management for the rich data visualization, and more importantly, you have the visualization templates. You can customize them tailored to your website needs and embed them right onto your website. It is built around the idea that data visualization and business analytics should be easy to use and completely customizable for every business. With it, you can even generate industry benchmarks in real-time, and it offers data visualization and business analytics.
With it, you can create dashboards with drag-and-drop tools and instantly visualize your data. It works with you to create customized dashboards specific to your business needs and then provides a series of interactive visualizations that tell a story of success and growth. It helps its customers to present data in a way that gets attention and ultimately leads to informed decisions about business results. The software as a service s seamlessly integrates into your business’s current reporting process and begins to collect data in the background.
#4 Raport

Raport is data visualization and business analytics software that helps you make your vision a reality. It comes with the drag-and-drop visual editor lets you create reports and dashboards that not only look great but can also be easily understood by anyone, including your clients. It also tracks how people are viewing your dashboards and reports, allows you to respond in real-time, and gives you insights on how to improve the user experience. It is a team collaboration software that connects data to people. An in-depth analytics and visualization tool, it empowers teams to identify, understand, and solve business problems.
Raport has helped thousands of companies across the globe make better business decisions by putting all of the information they need at their fingertips. Create dashboards, share insights, and measure performance in real-time without being locked into any one system. Raport offers a new way to turn data into action that is simple to use and completely customizable to an organization’s unique way of working. There are multiple features on offer that include unlimited metrics, multiple data sources, custom alerts, email reporting, data history, data dimensions, robust integration support, and more to add.
#5 Vizzlo
Vizzlo is an enterprise data visualization and business analytics software that helps businesses obtain insights from data, removing the complexity of both data analysis and data visualization. It is a web dashboard builder that allows business users to create data-driven deliverables for their business, thereby supporting their decision-making. It allows any employee across all departments and industries to easily create visualizations that matter for their business with charts and graphs.
The platform helps organizations build their own branded platform for their business without requiring them to engage in technical or design work. The software aims to create a new category of enterprise data visualization software that is focused on making analytics easy enough so that anyone can create a visualization to get immediate results. With Vizzlo, companies can take their existing data from the data warehouse and easily turn it into visual, actionable insights.
This allows employees to build reports and dashboards in minutes rather than hours or days. A simple interface makes it both flexible and collaborative, allowing users to work together in real-time on projects from any location. With everything your team needs within reach and an automated workflow that keeps everyone informed, it ensures no valuable insights will be missed, or late discoveries won’t get lost in translation again.
#6 Databox
Databox makes business analytics easy by taking it out of spreadsheets and putting it into its own dedicated web application. It is a data visualization tool that lets anyone create beautiful, intuitive interactive reports in minutes. It also provides real-time data visualization and KPI dashboards, which make it easy to track company performance and key metrics. Databox is created to provide a web-based software solution where business users can easily create and share dynamic data visualizations that deliver on all of their business needs. It is a cloud-based software suite that includes a data connector, report designer, and visualization editor. These three components work together to help business users from all industries easily create visual reports and dashboards for different purposes.
It seems to be one of the leading data visualization software designed specifically for business teams. With it, you can create interactive reports and dashboards that look great on-screen or printed out. You can publish them online or offline and share them in person or online. The great thing about Databox is that you don’t have to be an expert in data visualization to use it. Instead, we take care of the design for you—letting you focus on telling a more compelling story with your data.
#7 LinceBI

LinceBI is an intelligent data visualization and analytics platform that helps you build shareable data-driven business stories. The software comes with ease of installation, multiple configuration options, and has all the training and support included. With LinceBI, you can embed dashboards into your Slides presentations, conduct live interviews and share live datasets for deeper analysis. You can also invite attendees to collaborate on data and dashboards in real-time. And if you want to continue the conversation after the meeting, it makes it easy for anyone to download data and customize visualizations.
It helps people to get faster insights and to complete their Data Science projects. Moreover, you can easily create and share beautiful visualizations from any data source connected to the G Suite. LinceBI is software for business intelligence built with and for data scientists. It merges the power of image recognition and data science to build dashboards where visualizations react to the data itself.
The user can easily create dashboards with an intuitive drag and drop interface. LinceBI also provides a set of analytics tools that can automatically capture key metrics from the user’s database and helps them to define alerts on these metrics. In addition, it offers a variety of features that facilitate the analysis of data, such as Anomaly Detection, Change Detection, KPI, Multi-dimensional Analysis, and others.
#8 Visplore

VISPLORE is the premier data visualization and business analytics software for mobile, desktop, and data scientists. VISPLORE offers a huge range of features and capabilities in a single, high-performance package that can be used to produce reports, perform analyses and create interactive data visualizations. Its unique features and functions help users find new value in their data. Whether they are looking to uncover and resolve specific issues or they are simply interested in learning more about their data, it provides the tools to present data-driven insights.
VisPlore is the leader in data visualization and business analytics software, making it easy for individuals, teams, and companies to effectively communicate data-driven insights and discoveries. Featuring a drag-and-drop design and a simple user interface, the software helps users quickly visualize data and effortlessly share their findings across various devices, from smartphones to tablets to laptops. With a variety of templates, colors, fonts, layouts, and styles, users can instantly create captivating stories with their data. And by adding annotation, animations, links, and audio files – along with a variety of other elements – users can tell their story in a way that makes sense to their audience.
#9 Datacopia
Datacopia is a software that specializes in data visualization and business analytics software. This scalable SaaS solution is delivered through a simple API. This is a very powerful and advanced market tool that allows users to export real-time data from the terminals and feed them into the Datacopia software. From there, users can build advanced analytics using the most advanced AI technology available. It runs on a cloud-based solution that helps enterprises leverage their existing data. It visualizes the data and produces insights that help create efficiency and improve decision-making.
The unique feature of Datacopia is its ability to offer analytics in a very natural language and a simple user interface. The app can be used without any programming experience by simply dragging and dropping charts, tables and graphs. This data analytics and visualization software provide predictive analytics to drive efficiency and business insights in organizations across the globe.
#10 SeekWell

SeekWell is a Business Analytics and Data Visualization platform that empowers companies to optimize their digital marketing spending, improve customer experience and increase ROI. With this software, you can get SQL data in the spaces you need it, like Google Sheets, Salesforce, Zendesk, and Slack. Unlike other tools on the market, Seekwell is focused on design first, making sure the interface is simple enough that users can create and customize beautiful reports in minutes.
The problem SeekWell solves is that businesses are drowning in data and don’t know how to analyze and make use of it. The software helps them not just get the data but also tells them what action to take. Seekwell analytics platform makes it easy for companies to visualize their data with simple charts and dashboards. What makes it special? It’s all about the visuals: it helps users tell the story behind their data and see results in real-time. It provides users with the ability to create dashboards and reports of various metrics in different views, including a Table view, Pie Chart view, Calendar view, and Bar Chart.
#11 Stagraph

Stagraph is a solution for businesses to visualize, understand, and share their data. It helps data teams and analysts quickly visualize data in meaningful, insightful ways that drive business decisions. This visualization tool is used by professionals worldwide, and it allows its users to take raw data and create professional-looking reports, dashboards, and infographics with ease. It offers a wide selection of templates for different industries and corporate applications, as well as many customization options.
It comes with best in class artificial intelligence platform for the visual representation of complex information, integrated directly with Microsoft Excel. Stagraph allows you to take advantage of AI to automate your analysis, increase your productivity, and level up your ability to make informed business decisions faster.
Users can also create their own templates and save them for future use. The software has many options for controlling the visual aspect of reports, such as changing the color schemes and their grids, using graphs, charts, bullets and pie charts, and much more. From CEOs and CFOs to Sales Managers, from Marketing Managers to Human Resource Analysts, from Market Researchers to Consultants – any professional who needs to present data in an attractive format will benefit from this alluring software.
#12 Rational BI
Rational BI provides software for business analytics and data visualization. It enables to make better decisions about data through its products. It provides Business Analytics which is a dashboard tool that helps companies collect, integrate, and analyze data in one convenient place. It allows users to access data from sources such as Salesforce, Analytics, Twitter, and Facebook and create interactive dashboards for reporting and analysis. The product for Data Visualization helps companies create visually engaging data reports from their existing data in Salesforce or multiple sources.
A leader in business analytics software, Rational BI empowers companies to make better decisions with more confidence. Our software provides a real-time view of key business data and lets users visualize data so they can understand and explore their data’s relationships more easily. The platform is committed to the success of all the customers – of any size, in any industry – and it provides the tools and solutions they need to leverage big data to increase efficiency.
#13 Sympathy For Data

Sympathy For data is one of the leading open source platforms which is responsible for creating and running data analytics and data science applications. It is on a mission is to enable all decision-makers to successfully leverage data visualization and business analytics software to make better-informed decisions faster and more easily than any other organization.
It provides data visualization tools that represent the most efficient means for human beings to identify opportunities, explore new ideas, and make informed decisions. It aims to make it easy for everyone to discover and share insights, and we strive to automate away anything that gets in the way of you and your data. Customers love to use its products because it makes data easily accessible to all their users, regardless of technical skill or IT department. There are multiple features on offer that include reusable components, manual inspection, building reusable data processing workflows, data transformation, flexible configuration options, internal storage, scripting, and more to add.
#14 Apache Superset

Apache Superset is a high-performance, open-source data exploration platform for working with messy data. It allows you to work with many types of data, including SQL and NoSQL, structured and unstructured, real-time and historical, from anywhere and in any language. Apache Superset is an open source data exploration and visualization tool that combines the usability of a traditional spreadsheet with the power and flexibility of a database. Superset offers rich support for visual analysis of data, including live charts, real-time updates, and dashboards for collaboration. Superset also supports inline data filters, table joins, and calculations
It is the most popular open source business intelligence and data visualization data analytics software for the modern web, cloud, and IoT apps. To many companies, Apache Superset has become an irreplaceable tool for their technology stack. The open source product allows you to explore, visualize and analyze data in real-time from any application or database engine. It allows you to turn your data into interactive dashboards and reports, allowing you to share insights at the speed of thought.
#15 JetPack Data
Jetpack Data is the data visualization and business analytics software from Jetpack that enables anyone to, simply put, discover the story in their data. Marketing agencies, freelancers, and consultants using Jetpack Data are able to offer businesses an end-to-end solution that combines reporting and business analytics with design work to deliver data-driven insights and reports.
The new website includes a quick overview of how data is used as well as an overview of how the product works for marketers and other business owners. Data is the common thread between marketers, designers, and developers. It unlocks this value by empowering businesses with reporting and visualizations that quickly turn complex data into actionable insights. The core features are a wide range of data formats supported, cloud or on-premise support, high customization, automated dashboard & reporting, embedded analytics, and more to add.
#16 Ananas Desktop
Ananas Desktop is the most advanced data visualization and business analytics software, specifically designed to be used by all departments from sales to marketing to finance, and operates with all major databases. Instantly visualize data into informative dashboards designed uniquely for your business, or connect it to your favorite apps to get live updates on your analytics dashboards as they happen. Ananas Desktop is the only tool you need to take your data to the next level. The software allows users to visualize, analyze and manage data from different sources.
The software allows users to connect different data sources and view them on an interface in order to visualize, analyze, and manage these data. Ananas is a data visualization and business analytics software platform that makes it easy to build interactive and shareable dashboards and reports. It takes a human-centered approach to analytics and data visualization, allowing you to effectively communicate your most important information and insights.
Ananas’ plug-and-play template library lets you get up and running quickly, and open API means you can create custom reports that are unique to your business needs. There are multiple features of it that include: drag and drop pipeline editor, fail fast development process, support I/O, parametrize queries, run any volume of data, and more to add.
#17 GGobi

Ggobi is a free Python software package for visualizing data, that is useful for visualizing large-scale data in your research; it is not intended for export to presentation graphics or publication purposes. It is an interactive data visualization and business analytics software tool that allows you to share your insights in a visually compelling manner. Ggobi is an open source software package that is used to make data analysis easier in a variety of fields.
It works by allowing users to import data and visualize it in a number of formats. It can be used on multiple platforms and is designed to work on touch screen phones, desktop computers, or any electronic device with a web browser. Ggobi is originally developed for non-specialists to help them visualize their own datasets, but analysts at companies like LinkedIn, Yahoo, and eBay have started to use it in data analysis and business analytics. It’s designed to be easy to use while still allowing you to create sophisticated interactive visualizations and business analytics.
#18 Whatagraph

Whatagraph is a marketing performance reporting system that automatically converts websites and social media data into simple, visual, and understandable infographic reports. The solution supports multiple integrations that help you to take reporting to the next level. Whatagraph is also known as the business intelligence system that provides modern businesses with a fresh and very visual way to present analytics data in multiple forms that people can quickly ingest.
With the help of this software, you can easily display analytic data in a unique infographic style of reporting that is better than graphs. One of the most exciting and enjoyable things about this platform is that it offers an automated data gathering capability that automatically gathers information from 15 data sources such as Facebook, LinkedIn, and Google Analytics, etc.
After collecting information, the tool generates the report and then sends them to your recipients. To make the service more interesting, it offers a simple customization option that allows you to create a custom setting and enjoy more features. Just like the other similar BI systems, it also offers lots of key features that make it more attractive. Whatagraph has different price plans, and each plan has its own cost and advantages.
#19 Owler

Owler is a business intelligence platform developed to provide companies of any size across various industries with reliable and highly actionable business insights on a regular and timely basis. It offers a comprehensive business profile of up to 15 million companies. Aside from the solution delivers daily snapshots and new detailing movement, updates, and events in the industry. With the help of this program, the user can quickly see how the company fares against the competition and delivers your crisp and easy-to-understand visualization to help users to determine the area of concern and more.
Compared to the others, it offers high-value competitive intelligence via a very innovative crowdsourcing approach. Owler also allows users to get business data from various sources and communities on more than 15 million international brands. The solution includes prominent features such as web-based, competitive analytics, the weekly showdown, and much more with a simple and user-friendly interface.
#20 Qlik Analytics Platform
Qlik Analytics Platform is a program that provides all the tools developers require to create unrestricted data-driven solutions. It is a leader in visual analytics, and its modern analytics platform supports the creation of custom and guided analytics applications such as web mash-ups, etc. The solution is mostly used to apply business intelligence strategies to customers and partners via their extranet and internet websites.
Qlik Analytics Platform helps to create more significant interaction and collaboration through data. It allows more free-form exploration of the data without needing to pre-determine the type of questions the user may have. It also integrates with lots of advanced tools and features that make it better than others. Some most prominent features are APIs for backend management, direct API access, application toolkit, and much more.
#21 FoxMetrics

FoxMetrics is a powerful marketing analytics and personalization platform that allows you to interact with your data, compared with others, and deliver insights that drive decisions and steer your business to success. One of the most exciting and enjoyable things about this application is that it has a powerful conversion tool that gives you the ability to gather detailed user data, split information, and set triggers to personalized messages across a number of channels.
FoxMetrics offers an interactive, user-friendly, and robust marketing analytics system; all you have to do is copy and paste their script. As Tableau, it also allows you to create a dashboard and share it with the partners, colleagues, or customers to manage their work. HTML bars, email capture, dynamic content, polls, net promoter score, pop-ups, and product recommendations are prominent features of this BI system.
#22 Pyramid 2018
Pyramid 2018 is another business intelligence, and analytics platform enable data manager to create an environment that can meet the enterprise’s analytical needs and prepare it for future industry challenges. It is a simple and easy to use platform that is best for any business.
It can run on any operating system and smartphone and also able to deploy in any environment. The most exciting thing about this platform is that it has six diverse modules specially designed to provide users with distinct analytical tools.
Pyramid 2018 also has powerful embedded ETL tools that provide access to extract, transform, and load tools without any limitation and permission. The tool has thousands of users around the world, and you can access it anytime, anywhere around the world. It has different price plans; each plan has its own cost and features.
#23 Looker

Looker is a leading business intelligence software or data-discovery application that provides an intuitive approach to data exploration. The tool offers an interactive web-based interface that business users can utilize to tap into the enterprise of their data analytics team. Because of the web-based platform, you can access it anytime, anywhere around the world.
With the help of this application, you can easily create and share reports. Looker can help all companies use data to drive their business decisions and activities in the right decisions. Like the other similar platforms, it also offers a customization option that allows you to add the custom setting.
There is no complicated coding; you need to flow the given instruction and tools to make a powerful system. Looker includes self-service features such as filtering, pivoting, and creating an interactive dashboard. It also has a list of core features that make it more interesting.
#24 Jaspersoft

Jaspersoft is one of the most effective business intelligence platforms that allow better decision-making with the help of highly interactive reports, analytics, and dashboard. It is a simple but powerful tool for all kinds of companies. By providing support for big data and cloud deployments, it allows its users to deliver efficiently on the promise of self-service at scale.
The great thing about the tool is that it uses lots of commercial open-source business models and is trusted by a community of up to 250 000 registered and has more than 15 million users around the world. It is one of the best BI platforms that allows you to easily create a dashboard with custom settings and share it with others without any limitations.
It is also known as the embedded business intelligence solution with data visualization, analytics, and reporting capabilities specially designed for small, medium, and large businesses. Data integration, data analytics, ODS, OLAP server, metadata layer, multi-tenancy, and audit logging are core features of the platform.
#25 Datanyze
Datanyze is a robust sales intelligence and lead generation platform for web technology companies. It continuously evaluates millions of websites to find out which technologies are being used. With the help of this app, users can create custom alerts and get notifications whenever a website starts or stop using web-specific technology. It is also known as an all-in-one platform that helps you to increase your productivity.
Just like the other similar platforms, it is also integrated with third-party solutions such as Jigsaw, CrunchBase, and LinkedIn to provide information about contacts and leads directly to the web app. Datanyze users can avail of an unlimited number of reports, queries, and lookup. You can easily set up this tool without any permission. It includes core features such as alerts, countdowns, correlations, email fender, lots of advanced technologies, and much more.
#26 Logi Analytics

Logi Analytics is a leading business intelligence system that allows companies to engage users and give them the intelligence they need. It is also known as a solution recognized by Gartner, helps programmers in providing services and smart applications for enterprise use or customer-facing purposes.
Logi Analytics also servers to allows users to connect all available data sources and to make information retrieval a smooth process. With the help of this platform, developers can connect their companies dispersed data sources that enable them to create a more robust, intelligence-giving application which provides accurate number and information to enterprise users and partners.
Logi Analytics provides users with total control over the style, function design of their application; they can customize it in several ways such as including through custom themes, CSS, and third-party controls and plug-ins. Logi Analytics also includes core features such as low-code development, theme editor, reports, interactive dashboard, self-service analysis, workflow management, and much more.
#27 Salesforce Analytics Cloud
Salesforce Analytics Cloud is a cloud-based analytic program specially developed to help medium-sized businesses to large enterprises. It is an all-in-one business intelligence system that allows you to manage your complete work, create documents, add custom filed, and share them with the clients and partners without any limitation. The platform is available to use on desktop and mobile devices with lots of advanced features.
All the functionalities come at reasonable prices designed to meet the needs of diverse users. Like the other similar BI software, it also offers a customization system that allows you to use the drag and drop method and easily share the dashboard. Self-service, instant access, mobile-first, user-friendly interface, share on the go, and much more.
#28 DAVinCI LABS

DAVinCI LABS is Business Intelligence (BI) or analytic data system powered by AI and specially created for enterprises value creation. It is an alternative to Tableau and offers all the similar services with some advanced features. The solution provides businesses with an artificial intelligence-based analytics system which spot and analyzes within historical enterprise data using machine learning algorithms.
The discovery will be used to create a deployable prediction model that can effortlessly and smoothly incorporate into virtually any strategic system. The program utilized lots of other functions such as credit scoring, fraud detection, target marketing, and highly actionable insight into the future.
Just like the other similar platforms, it also allows you to easily create a robust and reliable prediction model with few clicks and even able to share it with others. DAVinCI LABS is also an excellent tool that you can discover hidden and complicated patterns within your big data, and the whole discovery process can be accomplished within a single day. That means you can easily create several business roles based on intricate patterns. DAVinCI LABS also has a lot of things that make it more interesting.
#29 KPI Library

KPI Library is an all-in-one business intelligence system specially made for professionals who can increase their productivity. It is also known as a suite of key performance indicators that help businesses to determine the rights KPIs based on interests and industry. One of the most exciting and enjoyable things about this platform that it has a major source of KPIs for all the leading brands and corporations, such as Microsoft, IBM, Oracle, HP, and more.
It is the best tool for any industry and offers more than 6500 advanced temples and examples; you need to choose one of them and start creating data without any limitation. KPI Library has thousands of users around the world who can use it to manage the work.
#30 PDFelement
PDFelement is a Document Management System where you can create, organize, and secure your file. It is also known as a PDF editing system that manages your complete work. The solution is specially designed with usability in mind meaning that it gives you full control over your PDF content and a suite of almost unlimited transformation possibilities.
The great thing about this application is that it offers quite a simple customization system that allows you to perform all desired modifications without affecting the formatting or style of your documents. As compared to the other similar platforms, it is a little bit different and offers lots of new services to make your work fast and straightforward. PDFelement includes core features such as batch convert, spell check, form data, ready-to-use templates, custom fields, match font, file size optimization, and user permissions, etc.
#31 QlikView

QlikView is a BI (Business Insurgence) data discovery platform used to create a guided analytics application and interactive dashboard designed for business challenges. The platform offers a powerful Associative Data Indexing Engine to uncover data insights and relationships across multiple sources and improve the quality of your business decisions.
The tools offer both custom and default data connectors and open database connectivity connections. Just like the other similar platforms, it also allows you to create, manage, and share the dashboard with customers or colleagues to manage their data. The tool also offers exploration, discovery, and collaborative analytics for share insights.
QlikView also allows you to create and deploy analytic apps without requiring technical skills. It helps drive a quicker response to changing business requirements, a shorter time to value, and more insights across the company. QlikView is an alternative to Tableau and offers lots of new services that make it better than others.
#32 Sisense

Sisense is a Business Intelligence system that allows you to join, analyze, and picture out the information you require to make better and more intelligent business decisions as well as create workable plans and strategies. It is more than just software that makes your all professional tasks without any extra effort. With the help of this solution, you can unify all the data you ever need and want into visually appealing dashboards via a drag and drop user interface.
The platform allows you to turn your data into highly valuable insights and then share them with partners/colleagues via an interactive dashboard. To make the service more engaging, Sisense offers lots of advanced tools that help you to manage other business-related tasks. The centralized data hub, drag, and drop, filter data, data mash-ups, remove limitations, and a wide range of advanced widgets are core features of the platform.
#33 ZoomInfo

ZoomInfo is a subscription-based Software-as-Service (SaaS) platform specially made for those who want to get in touch with the right people and networks. It is a simple but powerful application that helps you find prospects based on industry, location, company revenue, job function, and more.
Its database provides access to the most direct dials and email addresses as compared to the other market intelligence provider. With the help of this application, you can easily create an accurate and detailed contact list to build targeted campaigns guaranteed to reach your best buyers.
Just like the other similar application, it also has lots of productivity tools that increase your workflow and manage the major task. Organize, cleanse, and evolve your database to keep your contact and account data accurate and up to date. One of the most exciting and enjoyable things about this application is that it offers a customization option that allows you to add your custom setting. ZoomInfo also has a prominent list of features that make it better than others.
#34 Alteryx

Alteryx is a business intelligence solution for data analysts that offers predictive analytics and data mining. It contains three primary components, such as Gallery, Designer, and Server, that blend data from external sources and creates comprehensive reports. Each component can be used separately. The solution allows users to blend data from disparate sources, including Salesforce, Microsoft Excel, and Hadoop, with built-in drag and drop features to generate raw data for analytics.
The best part of Alteryx is that it provides a multi-deployment option that includes on-premise and SaaS. It is also known as an invaluable asset for preparing and blending data into repetitive and intuitive workflows that objective is to stop the expensive fuss from wandering across the platform and summarizing information in the manner. Like the other business intelligence system, it also has a set of tools that make it more powerful. Alteryx includes core features such as data blending, sharing, drag and drop, import package, spatial analysis, and mapping, etc. With a simple and user-friendly interface.
#35 Meltwater

Meltwater is a leading online solution that provides all-in-one media intelligence solutions for companies to make more informed decisions based on the insights it offers in real-time. It is a powerful solution that allows you to stay on the top of billions of online conversations, extract relevant insights, and use them to strategically drive brand perception for a company that generates results and growth.
The solution provides real-time monitoring, which enables you to track your brand the competition and relevant news as it happens in real-time. The most exciting fact about this online platform is that it allows you to create your dashboard, which can effectively measure your success in your marketing strategies.
You can see brand reception where the brand’s most receptive audiences are located, media coverage, and return investment level, and performance comparison with the competition. Meltwater also includes core features such as trending theme, unified inbox, post scheduling, coverage by location, one-click visibility, and much more. There are multiple SMP and enterprise plans are available; each plan has its own cost and core benefits.
#36 Domo

Domo is a Business Intelligence solution that offers the widest dataset and connector support among the tested tools and delivers a unique set of social collaboration features as well. It is a simple but powerful, reliable cloud-based operating system created to help businesses find valuable solutions.
The solution gives decisions maker the ability to view real-time data in a single dashboard. As compared to all the other similar business intelligence solutions, it introduces lots of new features and functionalities that make it better than others.
The solution is also known for its flexible array of data connection options. That means you can easily access all the data you need to make the decisions, whether you are a non-technical business user or a hardcore data analyst. One of the most exciting things about this solution is that it offers fully mobile-optimization to pull off a report from your smartphone.
Domo also gives you the freedom to visualize your data any way you want so it can inform the decisions that take your business move forward. The solution also includes core features such as create your dream dashboard, social sharing tools, project management, data visualization, and much more.
#37 Grow.com

Grow.com is an all-in-one advanced business intelligence application created for creative executives in small and medium-size corporate environments. The system is fully enabled to scatter data from a variety of local and third-party sources and also turn it quickly into the operable intelligence for savvier decision-making.
It provides primary metrics on the stunning and compact dashboard and also helps managers develop inspiring strategies at a fraction of their usual reporting time. Grow is also a very convenient tool, as Grow pulls in QuickBooks, Salesforce, and Zendesk data independently and showcases important numbers across various graphs to make sure data is never outdated.
Like the other similar application, it also has a powerful dashboard where you can access all features without any limitations. Another best thing about this solution is that it offers unlimited access to information from all devices and operating systems. Grow.com includes prominent features such as unlimited users, SSL encryption, fully customizable analytics, unlimited real-time updates, more than 300 pre-built reports, historical snapshots, and much more.
#38 Phocas
Phocas is a world’s leading BI (business intelligence) solution that helps you to make data-driven business decisions, learn new sales opportunities, and boost business efficiency. The solution is specially designed for non-technical users. It delivers a simple but powerful analytics capability that quickly turns data into the graph, chart, or map at a few clicks or touches of a screen.
One of the most addictive things about this application it brings up relevant data in just a few seconds on local, regional, or even global sales, price, inventory, budget, profit margins, and among others. Phocas enables us to carry data interrogation or consolidate data contact modeling and stay ahead of the competition.
The dashboard gives your company complete stunning visual summaries of your business data. Any user can quickly build an interactive dashboard, customize, collaborate, and revise it without the help of your IT department.
Easy integration, CRM, data warehousing, data mining, and predictive analytics, visualization, mapping, and full business intelligence suite are also a feature of the applications. There are multiple price plans available to use, each one has its price and core benefits.
#39 Active Intelligence Server (AIS)

Active Intelligence Server is another business intelligence solution that enables companies to analyze data instantly and create powerful and rich visualizations to show them the entire picture and help them come to intelligent decisions. It is a simple but powerful solution widely used in many industries, including education, retail, healthcare, and manufacturing.
Companies and organizations that have implemented AIS have seen significant improvement in their performance, better management of multiple facts of their operations, and reduced costs, among other benefits. It gives you a simple yet powerful data analysis and business intelligence solution that squeezes more out of your raw information than what other business intelligence software can offer.
Like the other similar business intelligence solution, Active Intelligence Server also provides you not just with standard reports but gives you a report on the fly based on real-time data. Active Intelligence Server enables you to make decisions anchored on real and reliable facts. It also has a set of core features that make it better than others.
#40 Microsoft Power BI

Microsoft Power BI is the world’s leading Business Intelligence Software designed and created to help businesses systematically scrutinize data and share insights. It converts the company’s data into an attractive and comprehensive able value that makes it simple for users and their company to collect information, organize and devise effective business strategies.
The solution also helps users track their business and derive answers fast via its comprehensive dashboard that is available to use on every device. It provides all the significant tools to quickly analyze, transform, and visualize and also allows you to share reports.
The great thing about this BI system is that it offers SQL Server Analysis Services through which users can quickly create reusable models using the overall data. Microsoft Power BI also enables self-service access to primary third-party cloud sources such as GitHub, Marketo, Zendesk, etc.
Its developers ensured their system could build into any software ecosystem, and the proof for that is the several connections to popular third-party software and Microsoft tools. Microsoft Power BI includes many prominent features such as Datasets, Trend Indicators, Ad Hoc Reporting, Dashboard, Navigation Pane and Online Analytical Processing, etc. It is available both in free and paid versions. The free version is not limited by any time. However, data of only 1 GB per user can be analyzed.
#41 TIBCO Spotfire

TIBCO Spotfire is a Business Intelligence (BI) solution that provides users with executive dashboards, data visualization, data analytics, and KPIs push to mobile devices. The platform is made for those who want to start a small business and then expand and scale up as their business grows. TIBCO Spotfire works with all the existing business intelligence and reporting tools while the organization can put its dashboard.
The solution consists of three different parts, such as Desktop, Cloud, and Platform, that can suit any business intelligence and analytics requirements. The platform is heralded as one of the best BI tools that are developed intently for real analysis and not just analysis designers.
Most of the users love the variety of visualizations such as pie charts, line graphs, and heat maps; these features help people to set their data to how their data represented, so they cloud understand them easily. Data discovery and visualization, event analytics, content analytics, dashboard, and modern collaboration tools are core features of the platform. TIBCO Spotfire is a powerful BI tool as compared to the others.
#42 Demandforce

Demandforce is an all-around automated marketing solution that comes with online booking and reputation management capabilities. The application is design for independent professionals and businesses of all sizes to attract more customers locally and from other areas with smart and automated marketing strategies.
With the help of this solution, you increase client engagement and perform lots of new strategies to grow your business. It is a cloud-based system that ensures clients do not miss their appointments and gives them a way to inform the establishment if they lose their booking or be late.
Demandforce mostly works on dental, healthcare, salon, and lots of other similar industries. It professionals to reduce no-show and delegate the feed time block to other customers or patients. The system enables this by automatically sending appointment reminders and conformations to the clientele that allows clients to inform their appointment whether or not they will arrive.
The solution introduces a Social Marketing feature that helps you to promote your business on all the popular social media platforms. Demandforce includes core features such as Email reminders, business listings, email finder, scheduling management, satisfaction surveys, and postcards, etc.
#43 Capital IQ

Capital IQ (also known as CapIQ or S&P Capital IQ) is a market intelligence platform created by Standard and Poor’s (S&P). This web-based application is widely used in multiple corporate finance areas, including equity research, investment banking, asset management, etc.
It provides research, data, and analysis on private and public companies to help finance professionals to perform a review and this analysis may support transactions such as mergers and acquisitions as well as its investment recommendations.
It is a complete solution for all the finance professionals that provide a massive range of information and data such as real-time market data, valuation, financial information, global market data, security pricing, research estimates, etc. Capital IQ can also save your time; as a financial analyst, it’s critical to get an analysis done as professionally as possible, and time is of the essence.
Instead of manually get annual reporting, 10-k, or 10-Q from EDGAR and then manually inputting that information into Excel, it can be faster to query the dare in Capital IQ. Excel plugin, dynamic presentations, more financial modeling resources, powerful tools, and a user-friendly interface are core features of the platform.
#44 Daylite

Daylite is a CRM software for small businesses that allows you to organize all your notes, emails, sales opportunities, tasks, calendar, and contacts on a single platform. It also allows you to combine these items so that you do not have to re-enter the same information or data.
Daylite is a simple yet powerful business productivity tools that can link people to track relationships, emails to products, notes to calls, and people to appointments. It makes it easy to find anything, which saves you a lot of time.
With this platform’s help, you can keep all customer info in a centralized place, including your calls, emails, meetings, and all the other project related to them. It also allows you to store all your project info in a single place, create new tasks, and share it with others.
Daylite is a cross-platform suction and offers syncs and updates the system automatically. The powerful CRM program includes core features such as smart lists, activity sets, offline access, reports, linking, mobility and contact management, etc.
#45 SAP BusinessObjects BI

SAP BusinessObjects BI is a reporting and analytics business intelligence platform for business users. It consists of numbers of reporting application that enable users to discover data, perform analysis to derive insights, and generate reports which visualize ideas.
The great thing is that it uses drag and drop functions and enables users to search and analyze data from a massive variety of sources. SAP BusinessObjects BI is a front-end BI platform, so the data is not stored at the application level but integrated from the multiple back-end sources.
Just like all the other similar BI platforms, it also has a powerful dashboard where you can enjoy all features and services without any limitations. The application and also accesses comprehensive business intelligence tools that convert your data into useful information and bring it to the people who need it to most with the extensive suite of BI applications. SAP BusinessObjects BI is a commercial application with different price plans; each plan has its own cost and core features.
#46 Lead411

Lead411 is a business intelligence (BI) solution that helps the marketing and sales teams identify and attract the client’s business’s right prospects. It is a powerful B2B platform that generates accurate and targeted contact lists to help marketers identify better leads and eventually increasing conversation rates.
The platform leverages its in-house developed search technology to generate an accurate contact list, which provides more credible records than those acquired through conventional contact list generators. Lead411 also offers all the required information about the target businesses. The marketers can use that information to create and customize the marketing plans for the specific prospects to their business interests.
Apart from employing advanced search technology to generate accurate contact lists, the solution provides humanitarian assistance in the form of an expert team that evaluates and analyzes that generated lists created for you and further refine them for a better impact.
Once the list is finalized, they are added to your database that saves many hours, which you spend in identifying the right target. Data exports, email notifications, CRM reports, easy integration with third-party tools, and list export are core features of the solution. Lead411 is a commercial solution and available to use on multiple plans; each plan has its price and core features.
#47 TIBCO Jaspersoft

TIBCO Jaspersoft is a cost-effective, flexible, and widely deployed Business Intelligence software that helps you to make better decisions with the help of highly interactive reports, analytics, and dashboards. By providing support for big data, mobile, and cloud deployments, the solution allows its users to deliver efficiently on the performance of self-service at scale.
Using the commercial open source business model and trusted by the community, the tool’s open-source software solution has downloaded more than 14.5 million times. TIBCO Jaspersoft designed for small, medium, and large size businesses through to enterprises. The solution allows all the application developers to use their reports, analytics, and dashboard into their applications.
The solution offers Java-based reporting library tracking and renders pixel-perfect documents with the use of data from any of your data sources. With this, you can store user profiles, dashboards, analytic views, and more with the solution’s centralized server repository. Data integration, multi-dimensional analytics, interactive heat map visualizations, ad-hoc report designer, and multi-tenancy are a core feature of this BI solution.
#48 Chartio

Chartio is an efficient BI (Business Intelligence) tool that is quick to set up and easy to use. It is a powerful platform that allows business users to explore their business data in real-time, generate reports, and manage all BI needs. The solution offers a drag and drops interface writer queries for your use, or you can also write and share your SQL queries.
With Chartio, anyone can easily create beautiful dashboards as well as visualization and share them across your organization or with your customers. It is a complete solution that helps businesses all over to analyze and track their circle business data. Chartio is focusing on creating an interface for data; the tools help companies to make better decisions and intuitive business analytics.
Just like all the other Business Intelligence software, it also offers a scheduling feature that allows you to schedule reports, email, and other type of notifications. Chartio also includes core features such as drag and drop interface, query mode, powerful filter, edit generated queries, add custom columns, real-time chart, and works on any device, etc.
#49 Relationship Science (RelSci)

Relationship Science (RelSci) is the world’s leading technology solutions company that helps individuals and organizations across the globe leverage their relationships for competitive business advantage. It provides in-depth information about more than 6 million influential decision-makers.
The best thing about this platform is that it offers Pathfinder and the other relational mapping tools that allow users to run paths between any entity to any other entity and get a complete sense of how they might be joined. It has no other functionality like it on the market.
More than 50 search filters allow its clients to create customized target lists that identify high-profile targets based on the particular industry, role, company types, and lots of other criteria. Relationship Science (RelSci) has a powerful dashboard where you quickly access, apply and access all features without any limitations.
#50 Tableau

Tableau is a business intelligence software that helps companies visualize and understand their important data easily. The platform allows you to quickly connect, understand, and share data with an efficient, seamless experience from the PC to the smartphone. With the help of this tool, you can create and publish dashboards and share it with colleagues without the need for programming skills. It is also known as the self-service analytics platform that enables you to look at data and answer questions quickly. You can easily create and publish any professional documents and share them with others without any limitations.
Tableau is savable to use on web-browser and mobile devices. It is quite simple and easy to use, which makes it possible to bring data for analysis with a few simple drags and drop moves. The solution also offers prominent features such as patented technologies, automatic updates, data notifications, share dashboards, filter data, and metadata management, etc. With a fast and user-friendly interface.