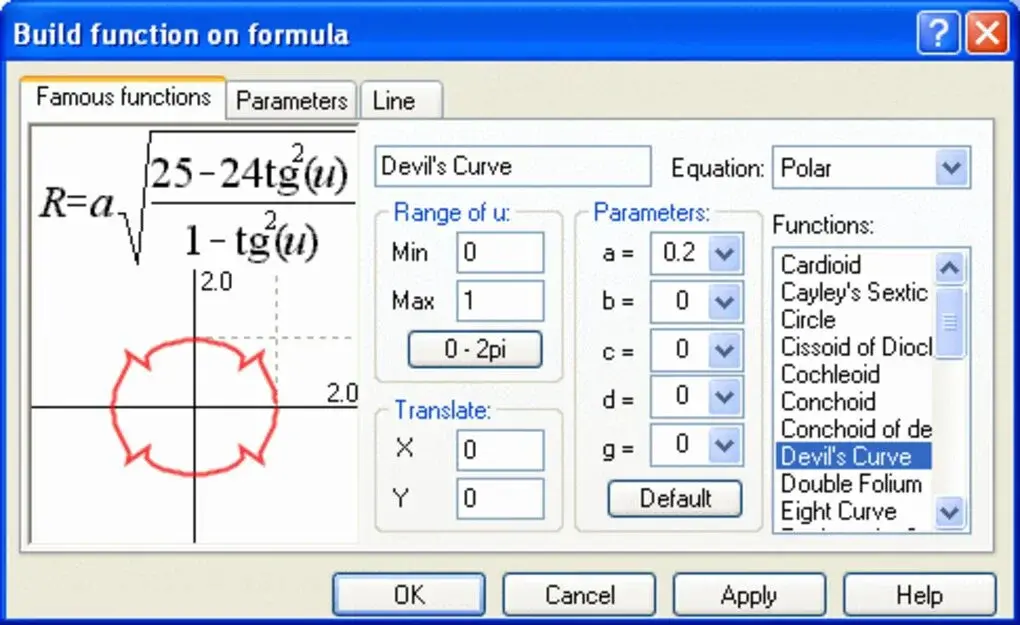
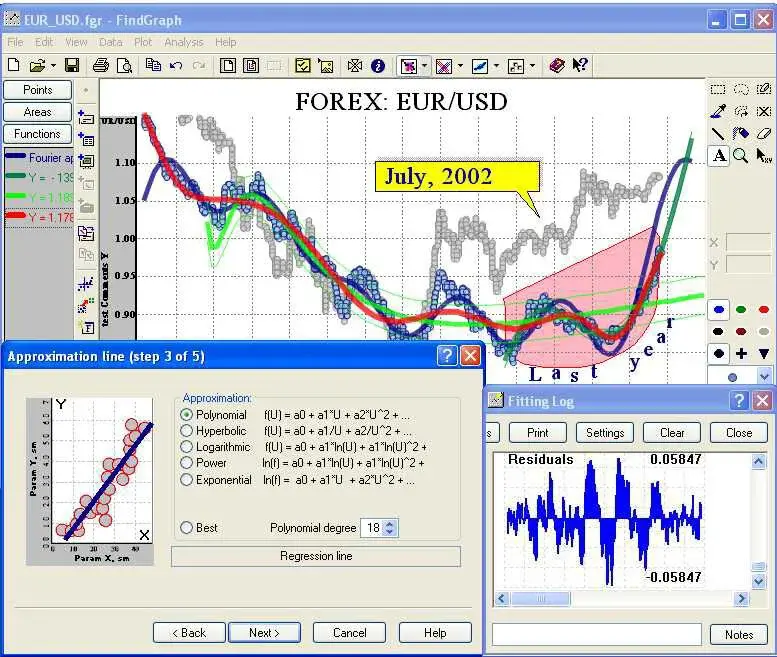
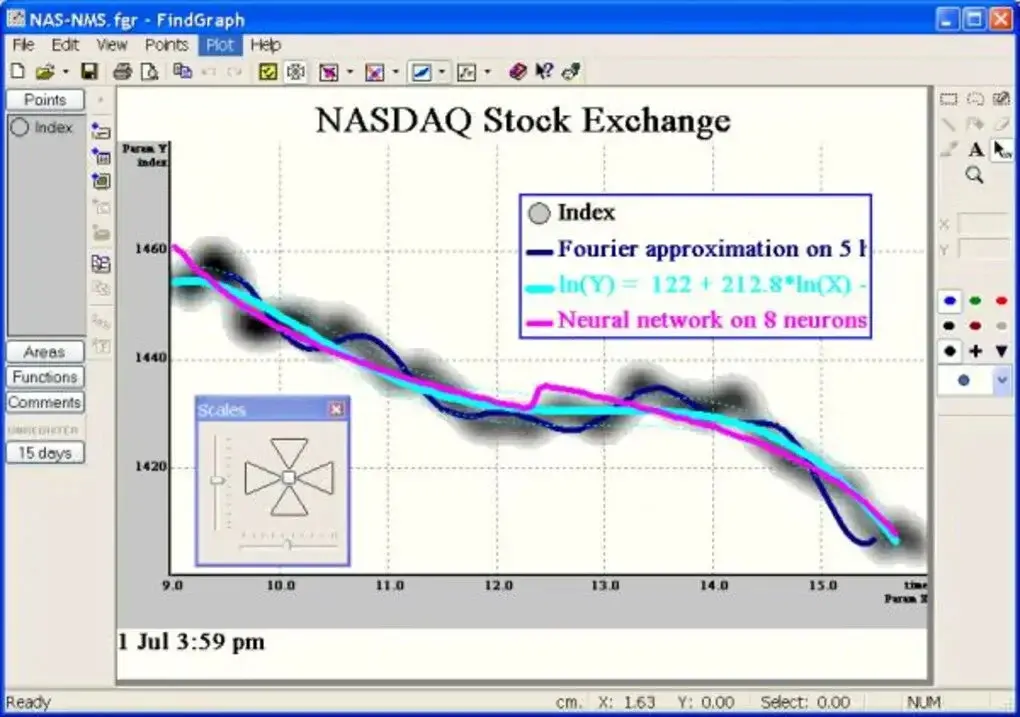
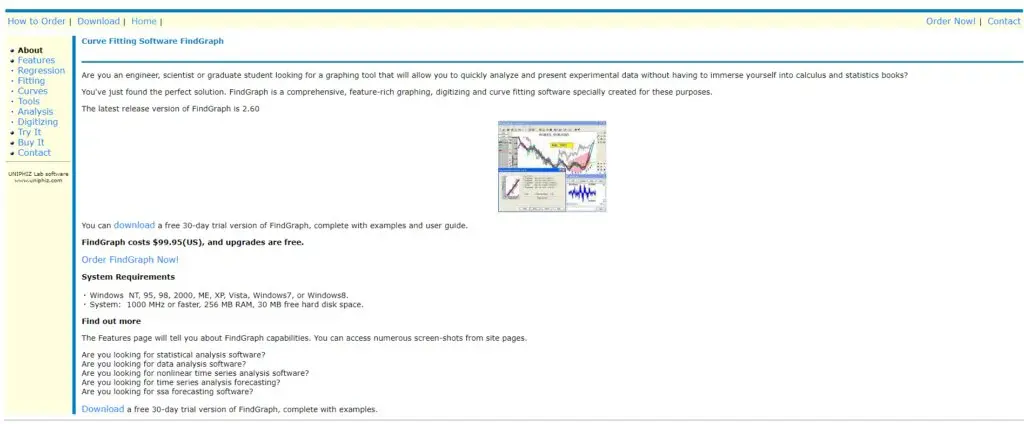
Find Graph
Find graph is a graph digitizing and data plotting software that is made for engineers, graduate students, and scientists for letting them rapidly analyzing and presenting experimental data. You can use it for your projects and converting theoretical data into an experimental ones. All this is done without having to dig deep into calculus and stats formulas. Find graph is aimed at people who want convenience as well as a functional data plotting tool. You can change the axes range in case you want to observe a particular portion of the graph in greater detail.
With the Find Graph, you can extract data values from published graphs, edit data value, smoothen the transformed data, discover the best model to describe the data, find the best equation, add text notations to plot, generate curves from formulas, and analyses 2D data that fits the results. Moreover, the software is multilingual with Spanish, German, English, and Portuguese support. All in all, Find graph is a great tool that you can consider among its alternatives.
Find Graph Alternatives
#1 DataThief III
DataThief III is software that you can use to extract the data point from a graph with the reverse engineering technique. This is done by scanning the graph from publication and load into the DataThief III. After that, you can save the coordinates so that they can be used in calculations or graphs that include your own data. It has a feature called axis recalibration that lets you insert the points between two points that are already digitized. The semi-automatic line-off plot digitization feature makes the plot a vector that you can calibrate according to your choice.
#2 G3data
G3data is open-source software that you can use to extract the data from graphs by scanning from scientific publications. It supports multiple image formats such as gif, png, jpg, xpm, pcx, tga, etc., and outputs the extracted data through a file.
The interface has a wide range of values and access points that can be set as default. Those values can be transformed into any kind of axes system and saved in ASCII format to use in other plotting applications. Another notable feature is that it can manage multiple data sets included distorted and tilted graphs. All in all, G3data is a great tool that you can consider among its alternatives.
#3 Dagra
Dagra is an advanced tool for plot digitization that lets you scan graphs, plot points, and coordinates. With this software, you can import graphs and use the Bezier curve tools to quickly trace a series of curves with points. Similar to the tools you’d find in CAD or drawing applications, Bezier curves let you get an accurate, smooth trace of your data very quickly. This will give you an accurate result even with the low res image. You can set the logarithmic scale to natural log or base 10 log axes. Place multiple axes to trace data from multiple scales.
The data you plot can be used in any data analysis software like Matlab, Excel, MathCad, and much more. It saves numerical data to tab or comma delimited text files. Dagra Datasheets provide a wealth of design information that is often presented graphically. Whether you want to show the color of a light-emitting diode with context from the eye’s response or show local temperature measurements against global trends, Dagra lets you digitize the data from multiple sources to pull them together on a single graph.
#4 Im2graph
Im2graph is a software that offers plot digitization from pictures. There lies a strong and efficient image processing algorithm at the core of its program that effortlessly converts scanned images into graphs with ease. There is a tuned DUI for more complex situations that enables faster image conversion. Using im2graph is intuitive and requires very little knowledge or effort on your part. This tool is the OCR equivalent of graphs which means instead of converting scanned images to text; it converts scanned graphs to data.
The premium version comes with OCR tech and has unlimited undo/redo capabilities as well as multiple graph support. You can load images with formats including PNG, JPEG, TIFF, ANI, CUR, XPM, TGA, GIF, PNM, etc. Moreover, you can choose a zoom level or fit the image to your screen to be able to view it in full screen. You can then define the X and Y axes, specifically X0 and X1, along with Y0 and Y1. Additionally, you can de-grid the file vertically or horizontally, as well as set a preferred threshold or a grid width.
#5 Engauge Digitizer
Engauge Digitizer is an open-source plot digitizing software that allows you to scan images and plot the data with detailed axes. It supports PNG, TIFF, and JPEG image files that contain graphs and helps you recover the data points from it. The grid lines are displayed for fine-tuning of axis and points, which define your coordinate system in use. The automated point extraction rapidly digitizes the data, which is done by a smart image processing algorithm that separates the subject and background to extract the required info.
Another highlighting feature is the cubic spine interpolation between points that provides more accurate curves even with a blurry picture or fewer data points. The axes checker tool simply highlights the axes when they are defined or modifies for revealing entry mistakes. You can also specify the graph coordinates as date and time values or as minutes and seconds. Multiple coordinates in a single picture are also supported. All in all, Engauge Digitizer is a great tool that you can consider among its alternatives.
#6 UN-SCAN-IT

UN-SCAN-IT is a software build for engineers, scientists, and researchers that can digitize the scanned plots of functional data. The software usually represents the data from references and reports in the form of X-Y type lines or scatter plots. The program allows you to take a scanned image of that plot in the form of JPG, PNG, or GIF and instantly digitize the values of the plot with its built-in OCR. You can manually select the data by clicking on each data point. The tool works with both linear and log axis scales. You can also digitize other data types like orthographic photos and scaled drawings.
UN-SCAN-IT has a feature called axis recalibration, which allows you to re-insert points between two already digitized points. Another notable feature is the semi-automatically digitize line off a plot. Automatic digitization is dependent on the image vectorization program, which is a part of this tool. Other features include deleting the points, dragging, computing their length, computing area, zooming images, and save calibration steps for later use. All in all, UN-SCAN-IT is a great tool that you can consider among its alternatives.
#7 jTechDig
jTechDig is a software written in Java that you can use to digitize the data from a scanned image of a plot or a graph. You can import images with jpeg, png, BMP, and tiff formats. The mapping of points can be done automatically or manually with the mouse and Bezier curve tool. Other useful tools include magnification, panning, rotation, line tool, pen tool, etc., which make the accuracy much higher. Ultimately, the processed data can be saved as a text file with the data separated b a semi-colon. All in all, jTechDig is a great tool that you can consider among its alternatives.
#8 Automeris WebPlotDigitizer
Automeris WebPlotDigitizer is an open-source web-based tool that you can use to extract data and points from plots, images, and graphs. It supports XY, ternary diagrams, polar maps, all that in multiple image formats, including jpg, png, tiff, PSD, etc. A browser plugin is also there to quickly upload the image ad digitize it without opening the web interface. One thing to know that it’s a semi-automated tool, unlike its alternative that is automatic or manual. The Automeris WebPlotDigitizer is a handy tool to reverse engineer the image visualization data for extracting the underlying numeric and other data in it.
Automatic extraction algorithms make it easier to extract a large number of data points. Another notable feature is the ability to measure the distance or angles between multiple points. All in all, Automeris WebPlotDigitizer is a lightweight tool yet packed with all the necessary features that you can consider among its alternatives.
#9 GraphClick

GraphClick is a graph digitizer tool that allows you to automatically retrieve the original x, y data from the scanned picture or a QuickTime movie format. This tool comes in handy if you only have graphs in the form of pictures only, but the data is not there. To retrieve the trajectory of an object in the movie, you just need to click the image, and the obtained coordinated of the points can be directly exported into any other plotting application.
The automatic detection of curves lets you easily connect points no matter they are dotted, dashed, or solids. It supports almost all types of images such as JPEG, PDF, TIFF, GIF, PSD, etc. With the frame-by-frame digitization of QuickTime movies and the modification for adjusting blur, sharpening, and edge detection. Another notable feature is that it can handle deformed axis, two coordinate axes linear, log, or inverse scales. All in all, GraphClick is a great tool that you can consider among its alternatives.