
GetChart.me
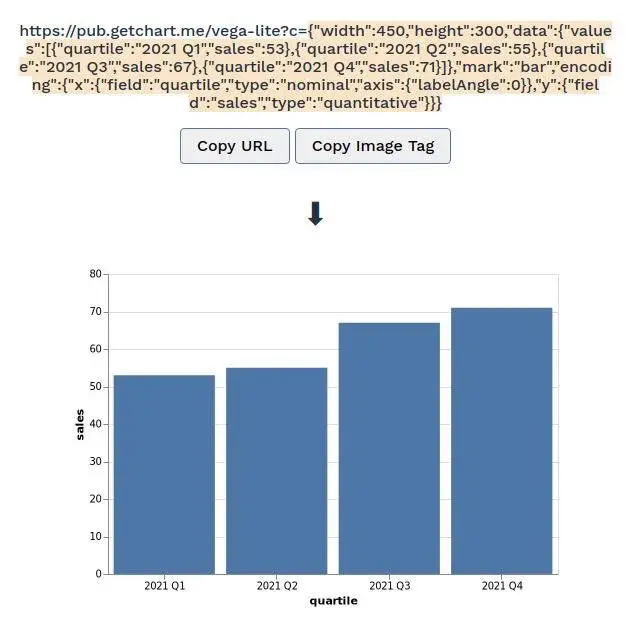
GetChart.me is a useful solution that enables you to generate chart images through URLs. The process involves generating chart images from URLs by utilizing free and open chart definition standards. After chart and URL generation, you can easily Copy the Whole URL by clicking the “Copy URL” button or just selecting a certain portion of it. There is also a “Copy Image Tag” that can be used to get the tag and paste it wherever required by the individual.
GetChart.me Alternatives
#1 Image Charts

Image Charts is a platform that allows you to embed image charts for markdown files, emails, blog posts, pdf reports, and more. It is highly reliable and trusted by multiple companies like Salesforce, Dropbox, Magento, Microsoft, and Sulekha.com. It provides an easy method to embed charts as an image in pdf, emails, and more, enabling you to avoid setting up, development and scaling of a complex server-side solution, which can take hours to complete.
The platform has spent years optimizing the chart API generation infrastructure, removing the burden on your shoulders. This means One API call equals one chart. Another feature is the blazing fast speed it offers, which allows you to generate charts in no time at all. The feature worth mentioning here is that you can add gifs in an email to bring a delightful effect and improve communication.
There is no need for server-side gif rendering or having to go through painful email attachments and headless browser tricks, as all the work is performed by the platform, allowing you to reap the benefits. Those who are used to Google Image Charts API would know that it is deprecated and has not gotten any support since 2015. One of the main goals of Image Charts is to work without problems with the Google Charts API while also extending it.
#2 Statpedia

Statpedia is an online solution that allows you to create a chart instantly and explore its library of statistics. You can create, tag, and share stats worldwide. All the stats are ordered by latest first, and you can scroll through the main page and click on anyone to learn more about it. You can also create your own chart by clicking on the “Create Stat” button, naming it, and selecting the desired diagram. Once everything is done, the stat can be easily shared via link, added to a website by getting the embed code, or Published online. One thing to note is that it is impossible to save the stat without first signing in.
#3 Visualis

Visualis is an open-source and feature-rich BI tool that has applications in data visualization. It is enriched with financial-grade data visualization functionalities on the basis of permissions, and data security, built on top of CreditEase, which is an open-source project contributed by Davinci. It is integrated into DataSphere Studio and is used every day by many people worldwide. With Visualis, you are able to access the development/exploration functionalities like drag & drop style report definition, real-time query, diagram correlation analysis, multi-dimensional analysis, data drilling, and global filtering, along with the addition of data quality and report watermark management.
The features include Dashboard/Display as an appjoint of the workflow of DataSphere Studio, Report watermark, Support for External applications parameters, Data quality inspection, One-click visualization through Scriptis, Report display enhancement, and Links transformation for big-data queries. The solution retains many of the original features of Davinci, including Data Source Support for files in CSV format, JDBC data source, and Data View Support with Writeback mode, Customized SQL template, SQL test, and highlighting.
A major highlight is that Integration support is offered, allowing you to Upload visual components in CSV format, Share dashboard and visual components in an authorized/common way. Also, interaction support is provided, which lets you display visual components in full screen, slider, and Paging mode for heavy volumes of data, Local controller for visual components, Group Control, and Locally advanced filter for visual components.
#4 ChartURL

ChartURL serves as a great substitute for Google Image Charts, giving you the ability to add meaningful, data-driven charts to your mobile and web apps, emails, and chatbots. The platform has added all the functionalities to assist you in adapting your data into chart images effortlessly. It is highly reliable and used by leading companies like Simple energy, Statsbot, and Amity. It helps in creating tons of personalized charts in a short time.
You just have to forward the data to ChartURL, who will convert it t an image and send it back. You also have the flexibility to use the provided API that can be integrated into the product or upload a CSV, which will be sent back with the exact file containing the appended URLs, making the entire process smooth and easy. The chart image URLs creation process is extremely simple and can be completed by closely following the given steps.
Start by first creating a template consisting of default parameters such as custom CSS, chart type, colors, and labels. After it is created, a slug will be generated. The second and final step is generating an image based on the template for which two methods are given. The first way is the Short URL, and the second one is the Signed URL. The reasons why ChartURL should be preferred are a library of amazing animations and interactions, Built on open-source charting libraries, Perfect Sizing, Style Once and Use Everywhere, and highly scalable.
#5 QuickChart

QuickChart is easy to use and open-source open API that makes it easy to generate chart images. As of now, it has helped people worldwide render more than a billion charts. You can easily generate QR codes, chart images, and PDFs without hassle. It is built on top of Chart.js, which is a major open-source charting library. Being very easy to set up, all that it requires from the individual is to put the definition in a URL.
Use the static customization options provided by the API and access the chart gallery to explore various chart types and plugins like pie charts, bar graphs, and line graphs. QuickChart offers multiple hosted solutions because it knows that rendering at scale is hard and consumes a lot of resources. A lot of time and effort has been spent handling the toughest parts so you can concentrate on creating applications. Charts can be utilized everywhere.
It is defined through the URL, making it easy to use the chart API in the desired programming language. Thanks to its capability of producing images, you can embed these charts wherever necessary. Many programming languages and frameworks, including popular names like PHP, Python, C#, Node/JavaScript, C#, and Java, are supported. A major feature is the No-code chart maker, which is ideal for those who don’t like editing charts manually. The no-code chart maker can be used to create custom chart templates that can then be embedded dynamically in AppSheet, Spreadsheets, bubble, Airtable, and several other no-code tools.
#6 Chartworks

Chartworks allows you to work with complex financial data and provides chart technology across images, HTML5, and iOS. The tool comes with rich and meaningful HTML5 Charts that can be run on a browser without needing the assistance of any plugins. It is fully responsive and looks brilliant on any device, and it also can be added to any site with a few lines of JS.
The highlights associated with this include a Full suite of upper and lower indicators, responsive layout which helps with rendering on the phone, desktop, and tablet, fluid zooming and panning of all chart data, extensive annotation and drawing tools, and Dynamic and Smart Y and X-axis labels while zooming and panning. Another feature of Chartworks is the Charting SDK for Android and iOS that enables you to add customized and prominent financial charts to the app.
You can allow users to experience a better charting experience. Individuals have the ability to add an interactive chart to the desired size to available apps, save and load a chart template, Pan, Pinch, Hold, and Zoom anywhere in the chart, Symbol Comparisons, Multi-touch Change and Data Crosshairs Calculator, and extensive customization abilities which makes it easy for you to create a custom theme for your chart. The final module/feature of Image-Based Charts, considered as an all-around workhorse and look best on each and every platform, regardless of the underlying technology. Through the simple and fast API interface, one can easily implement financial visualization to enhance their experience.
#7 Google Charts

Google Charts is an online tool that enables users to display their data on their website via attractive or straightforward visualizations. It is widely used with simple JavaScript embedded on the web page. With this tool, users can easily create simple line charts or build a complex hierarchical map.
The best part about this Google tool is that you can get to do this for free, regardless of institution or business you are representing. Aside from default Google them, users can treat a wide range of customization options for their charts.
This tool is quite easy to use as users only have to embed the tool, load the Google Chart libraries, and enter the data into the chart. After customization and assigning an ID, the chart can activate on the web page.
There is also a large community is there to answer whatever question you may have. Google Charts can insert interactive elements, including Events and Animations. Users have total control over how they display their data via its dashboard.
#8 Chartio

Chartio is an efficient BI (Business Intelligence) tool that is quick to set up and easy to use. It is a powerful platform that allows business users to explore their business data in real-time, generate reports, and manage all BI needs. The solution offers a drag and drops interface writer queries for your use, or you can also write and share your SQL queries.
With Chartio, anyone can easily create beautiful dashboards as well as visualization and share them across your organization or with your customers. It is a complete solution that helps businesses all over to analyze and track their circle business data. Chartio is focusing on creating an interface for data; the tools help companies to make better decisions and intuitive business analytics.
Just like all the other Business Intelligence software, it also offers a scheduling feature that allows you to schedule reports, email, and other type of notifications. Chartio also includes core features such as drag and drop interface, query mode, powerful filter, edit generated queries, add custom columns, real-time chart, and works on any device, etc.