
Knime
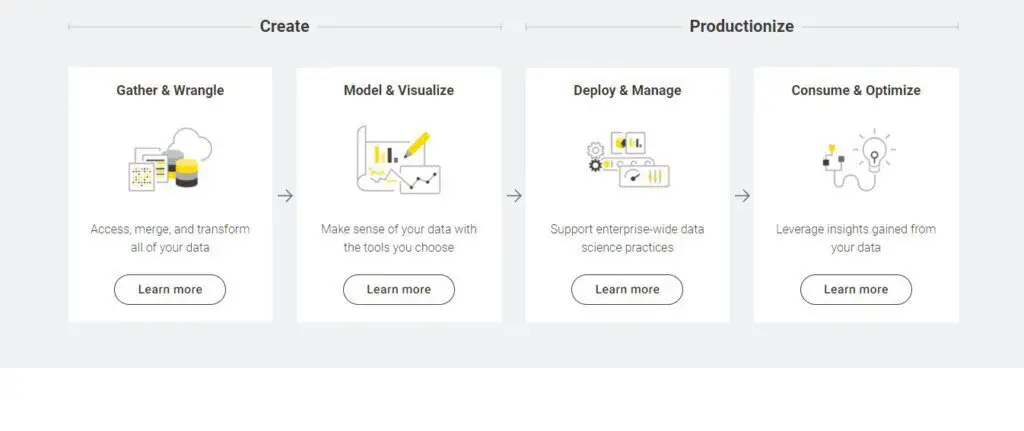
Knime is an analytics platform that offers services to users for creating data science by using an intuitive environment. The platform helps the stakeholders in the whole process to stay focused on what they are doing. It helps users in different ways, such as by gather, accessing, merging, and transforming all of the users’ data.
Moreover, it allows users to model and visualize their whole data to make sense of the data with the rights tools according to their usage. The software helps users in deploying and managing data while supporting enterprise-wide data science practices. It allows users to consume and optimize the data and leverage the insights gained from the data.
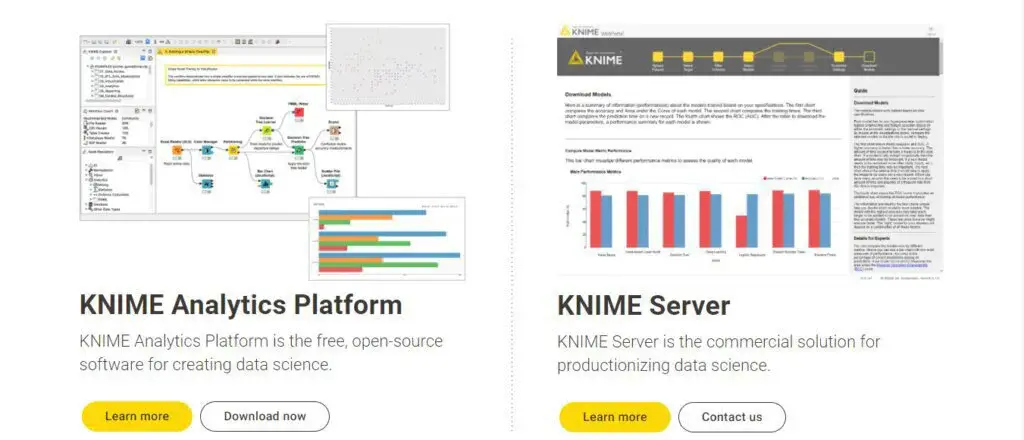
Knime comes with the analytics platform that helps users in understanding the data and offers help in designing data science workflows. It has a server that makes it an enterprise software for team collaboration, and management of data science workflows.


Knime Alternatives
#1 DataRobot

DataRobot is an automated machine learning platform that makes it easy for users to build and deploy accurate predictive models. The platform comes with the power of artificial intelligence that helps in accelerating every step from data to value. It allows companies to become more innovative, collaborates effectively, and effectively serve their customers.
The platform comes with an automated decision intelligence that allows all the stakeholders to collaborate in extracting the business value to form the data. Moreover, its Paxata Data Prep visually and interactively explore, combine, and shape diverse datasets into data ready at the enterprise level.
DataRobot offers automated machine learning that incorporates the world-class data science expertise and comes with an automated time series model that predicts the future values of a data series. Lastly, it also comes with a managed AI cloud service that provides all the flexibility and agility to users.
#2 Statista

Statista is a statistical analysis platform that enables users to perform analysis on different data sets and get reports of it. The platform allows users to get high-quality, in-depth information on important and trending topics, such as digitalization or AI.
Moreover, it helps brands to know what their consumers are thinking through the surveys. The platform enables companies to know about the behavior, attitude, opinions, and preferences of customers all over the world. Moreover, it allows users to get detailed information about the political and social topics of counties and regions.
The solution also enables users to create their business plan in simple three steps after selecting the market and region. Statista comes with statista research and analysis feature that helps users to understand the market and customers in a better way. Lastly, it helps in creating infographics, videos, and publications in the corporate design for the customers.
#3 MonteCarlito

MonteCarlito is a free add-in for Excel that allows users to perform simulation in it. The software working is simple; users can put all the formulas, which they want to simulate one after the other in the software. Users can select all of these cells in which the data is present and can select some extra cells for the display of output.
The platform also informs users if they want to run the simulations in a high-speed mode, they can use a negative number of trials. It displays the results in a chart form, and it allows users to create a histogram.
MonteCarlito comes with some amazing features such as it allows users to perform statistical analysis, i.e., mean, median, mode, skewness, etc. Users do not have to go anywhere and can get the direct output on the Excel sheet. Lastly, it is open-source software, which allows developers to expand it
#4 Displayr

Displayr is an online analysis software that allows users to perform analysis and reporting of the data through insights. It helps users to cut their analysis and reporting time to half and enables users to move faster in every stage. It provides users a dashboard, where they can see all the results of analysis and can also view their reports.
The platform offers the fastest tool to uncover and share the stories in your data, and both beginners and expert users can perform analysis on it easily. It comes with basic analysis and crosstabs, which users can use to create tables and helps in easy manipulation of data.
Displayr allows users to update their raw data and perform all the work automatically. It allows users to rapidly analyze and do the coding work with a click of the mouse. Lastly, it allows users to perform every kind of text analysis and coding.
#5 Statwing

Statwing is a software that helps users in analyzing the tables of data and allows them to perform analysis. The platform enables users to explore the data in seconds, and users can simply upload the spreadsheet and select the operation, which they want to explore. It allows users to clean the unclear data and can create charts in minutes.
The platform is better than other statistical software, and it helps you to stay confident in your analyses as it detects all the outliers. It offers clear and interactive output values such as p-value, effect sizes, confidence intervals, etc.
Statwing helps in visualizing every analysis and allows users to easily export data to PowerPoint to get into slides for the presentation work. It helps in statistically analyzing the quantified self-data to understand the patterns of data. Lastly, it allows users to perform marketing analysis and to know more about customers and their products.
#6 Jamovi

Jamovi is a free and open statistical software that helps shorten the gap between a researcher and statistician. The software has made the whole stats work simple, and it is known as the third generation statistical spreadsheet software. Moreover, it integrates the R statistical language that allows users to access the best statistics community through it. The platform is made by the scientific community for the scientific community, which allows users to get a complete suite for analysis.
Users can perform t-tests, ANOVA, correlation, regression, etc. It enables users to enter, copy-paste, or filter any of their data. Jamovi comes with R integration as R syntax that users can use for analysis and can run its editor directly in the software. The software allows users to introduce people to statistics through it. Users can contribute to the software in the coding process or financially.
#7 BlueSky Statistics

BlueSky Statistics is a fully-featured statistics application that allows researchers to perform all kinds of analysis and statistics on it. The software helps users to unlock the power of R for the analyst community and helps in data mining and data manipulation functions. Moreover, it provides a rich development framework for developing and deploying new statistical modules, applications, or functions with a rich graphical user interface.
The software allows users to browse, create, edit, and add multiple sets of datasets and variables to the analysis and perform the whole process with a single click. It enables users to access popular statistics with machine learning, data mining, and exploratory data analysis functions.
BlueSky Statistics comes with an R command editor that enables users to run R programs in automated or batch mode. Its outputs viewer allows users to share the results of their analysis, including the graphs with their team or customers.
#8 SOFA Statistics

SOFA Statistics is a user-friendly, open-source software for everyone to perform statistics and analysis. The platform enables users to make charts, produce attractive report tables, and perform a range of basic statistical tests. Moreover, the software can be used by researchers, students, data analysts, and other marketers for their product analysis.
The platform provides attractive output to users, and they can use it to generate reports directly through the results, and it focuses on the aesthetics of the results. Moreover, it allows users to connect directly to the database and bring all the tables to the software for the analysis.
SOFA Statistics supports different servers such as MySQL, SQLite, PostgreSQL, etc. Moreover, it comes with a tabular output feature that users can open in the MS Excel software. SOFA Statistics enables users to add data directly to the software by configuring new tables, and users can share the results easily.
#9 RapidMiner

RapidMiner is a data science and machine learning platform that allows users to unite their data and understand the changing trends through it. The software is a fully transparent, end-to-end data science platform that allows users to seamlessly integrate and optimize their data preparation for building ML models. It comes with a machine learning technology that enables users to design models using a visual workflow.
The platform allows users to deploy and manage models and turn them into perspective actions with complete end-to-end collaboration. It has a lightning-fast business impact that provides products to users through visual and automated analysis.
RapidMiner comes with jumpstart features which help users to accelerate business care success, and it helps in augmenting the whole research process. It offers model deployment and optimization, along with algorithm selection and validation. Lastly, it automatically builds visuals and helps in collaborating with business stakeholders for a model explanation.
#10 JASP

JASP is a platform that offers a fresh way to do statistics and comes with an intuitive user interface. The platform is completely flexible to use, and users can use it for free. It enables users to perform two kinds of analyses, i.e., Frequentist analysis and Bayesian analysis.
Moreover, it comes with a spreadsheet layout and an intuitive drag-and-drop interface, which allows users to place any data easily. The software allows users to do analyses such as Anova, A/B testing, binomial testing, Confirmatory Factor Analysis, Chi-square, Correlation, Exploratory Factor Analysis, etc.
Moreover, it allows users to add different data sets, and users can segment their data according to their needs. JASP allows users just to select the tests which they want to perform and click the done button, and the software will start performing that analysis. Once done, the results are displayed for users to understand different trends.
#11 Number Analytics

Number Analytics is a platform that offers statistical data analysis tools to users for marketing researchers, ANOVA, and other kinds of analysis. The platform allows users to perform all the basic statistics such as descriptive statistics, creating the frequency tables, finding the value of chi-square, or correlation.
Moreover, it offers a Choice-Based Conjoint tool that enables users to perform analysis for new product features and pricings to know how customers value their different attributes. It allows users to perform all kinds of regressions, such as Linear, log-liner, logistic regression, and many others.
Number Analytics enables users to use the K-means clustering to find the preferences across customer segments, and users can target different customers through it. Moreover, it enables users to perform advanced marketing analysis for finding the customer lifetime value, multi-dimensional scaling, and much more. It allows users to perform individual analysis of customers, segmenting them into different genders.
#12 PSPP
PSPP is a replacement for statistical analysis of sampled data and allows users to replace the SPSS freely, and users can have the same expectations with it. The best thing about this application is that it is free, and users do not have to worry about the expiry date of their license.
Moreover, users are free to access any number of variables, and they can use it any number of times without any limit. The software can perform descriptive statistics, along with T-test, Anova, linear and logistic regression, and it is a stable application.
It allows users to test their hypothesis, and they can use it to perform factor analysis, cluster analysis, and non-parametric tests. PSPP comes with a fast backend service that allows users to perform all of their research tasks as fast as possible. It supports the research of over one billion cases, with one over one billion variables.
#13 Deducer

Deducer is a platform that allows users to perform different statistical analysis, similar to the ones done in SPSS or JMP. The platform comes with a menu system that allows users to manipulate the data and perform all analysis tasks in it. It has an excel-like spreadsheet through which users can view and edit their frames.
The main purpose of the software is to provide an intuitive graphical user interface for R to encourage the non-technical users to learn and perform analysis without any expertise in programming. It enables users to perform different tasks with simple mouse clicks instead of hundreds of keystrokes.
Deducer comes with a moderated multiple regression and simple slopes analysis and offers respondent Driven sampling to researchers. It has an add-on package that covers different methods common in econometrics, which includes various time-series and spatial data methods. Lastly, it has a GUI generator and a text-mining tool.
#14 IBM SPSS

IBM SPSS is an advanced statistical software that allows users to perform their quantitative calculation of research on it. The software enables users to add their data to any extent, and they can add different features in it, such as mentioning the demographics, gender, etc. It helps researchers in ad hoc analysis, hypothesis testing, geospatial analysis, and much more.
The software enables organizations and researchers to understand the data, its trends, forecast, and plan to validate assumptions and helps in getting accurate conclusions. It covers different results, such as it provides users with mean, median, mode of the data, and values of kurtosis.
IBM SPSS allows users to test their hypothesis and measure the R-square value of the data. It also enables users to measure the consistency and validity of data to know that their data is not distorted. Lastly, it enables users to know where the problem is in their data.
#15 Cloud stats

Cloud stats is a statistics package that is open for everyone to analyze, giving adaptability and functionality to modern researchers. This stats generator allows you to work from any device you want, and you can do a complete range of statistical analysis in a more appropriate way. This software is allowing you to fluidize your experience in the development of the application and provides you a data that will permit you to build an application without any major errors.
You should not be worried about your internet connection working because you work offline in Cloud stats, so you will never be lagging anymore. There are multiple features on offer that works offline, installation-free setup, textbook integrated interface, send links, tools to teach coding, and more to add. Furthermore, Cloud stats is an ideal way to get done with your programming to build an intuitive interface, and novice can learn different coding having different programming language frameworks.