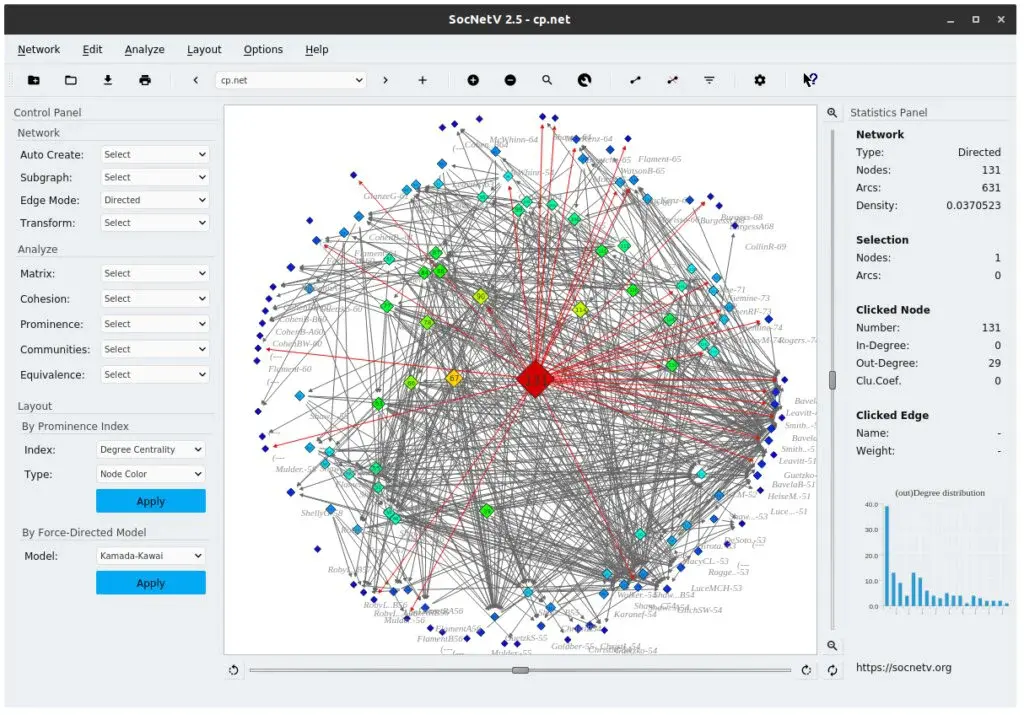
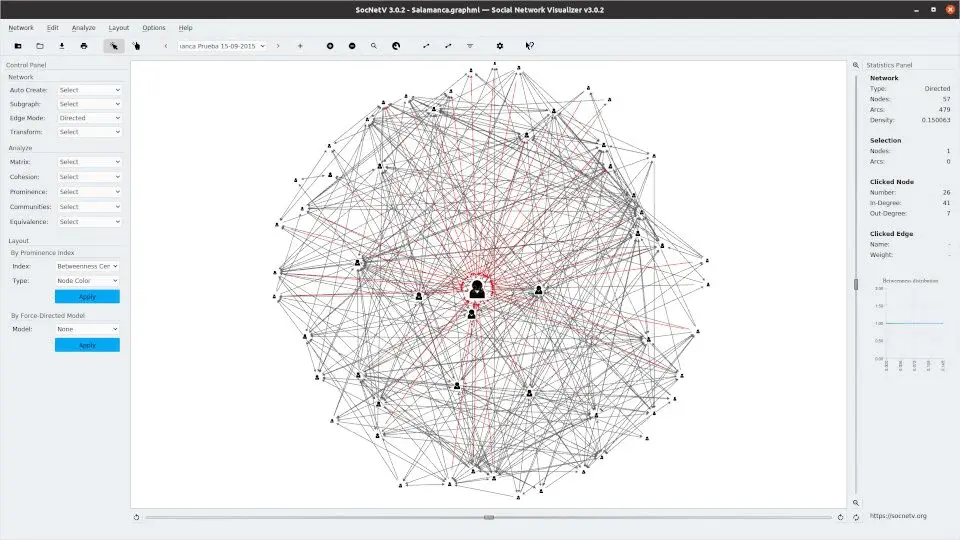
Social Networks Visualizer
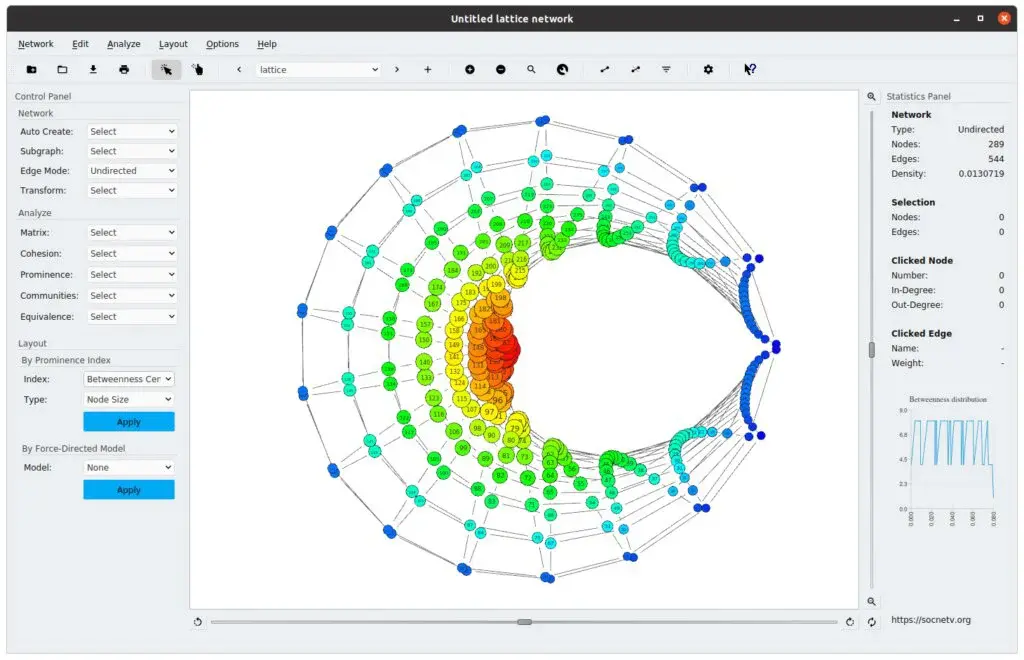
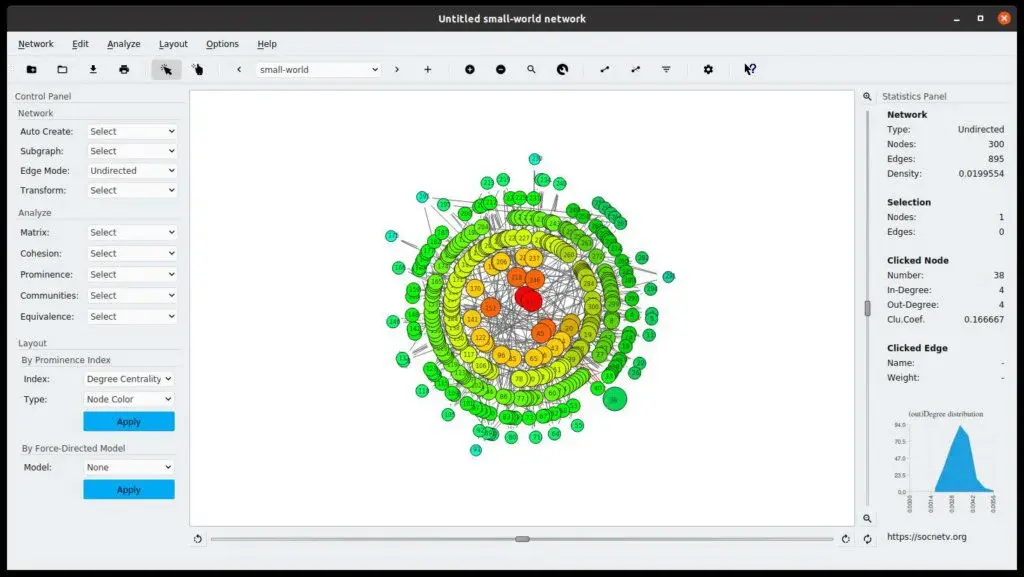
Social Networks Visualizer is a cross-platform solution developed to serve as both social network analysis and visualization solution for Microsoft Windows, Mac, and Linux. You can use it to draw social networks with a couple of clicks on a virtual canvas process field data from a file in several formats like UCINET, GraphML, EdgeList, GraphViz, Adjacency, GML, and Pajeck. Besides loading data, you can simply just crawl the web to build a social network of linked web pages.
Modify ties and actors via point-and-click, measure social network and graph attributes, generate stunning HTML reports, and embed visualization layouts to the network. The solution is open-source and can be used by everyone on their systems without any licensing restrictions. It comes with many functionalities, which makes it a good fit for small and large networks.
One of the features is Structural equivalence analysis, performed via Pearson coefficients, actor similarities, hierarchical clustering, and tie profile dissimilarities. You can access popular social network analysis datasets like Padgett’s Florentine families and more. It also has a Multirelational network editing and loading module that enables you to load the favorite social network containing various relations or create a new social network from scratch and embed several relations to it. Another great feature is the availability of multiple matrix routines like Cocitation, Laplacian matrix, and Degree matrix.
Social Networks Visualizer Alternatives
#1 Network Weathermap

Network Weathermap is a robust and open-source network visualization solution that enables you to use network statistics for creating live network maps. It gathers all data through the plugins available for Cacti-specific data, RRDtool, external scripts, tab-delimited text files, MRTG, and fping. The RRD tool offers access to data from many open source monitoring tools like Munin, Cactic, Routers2, and more. You can also use other sources via external scripts or plugins.
The solution comes with in-depth documentation along with an editor to help you create new maps without difficulties. The best feature is the presence of powerful Cactic integration that uses the Cacti plugin architecture to offer a management UI and access controls for maps by making use of the available Cacti’s user database. Network Weathermap is the go-to source for many individuals in the international and national ISPs, Fortune 500 firms, internet exchanges, national academic networks, tier-1 carriers, and telcos. It frequently receives new updates containing improvements and additional functionalities requested by the community.
#2 Ucinet

Ucinet is a software package for Windows that helps the community in analyzing social network data in a painless way. It is authored by a team of professionals that include Steve Borgatti, Lin Freeman, and Martin Everett. Apart from several powerful features, it is also packed with the NetDraw network visualization tool for your ease. Besides downloading the software, you can also get any of the Datasets provided on the site. These include Camp 92, 50 Women, Cond Mat, Countries Trade Data, Astrophysics, Autonomous Systems, and Celengansneural. Individuals can scroll through the Datasets and select the one they need without any cost.
#3 NodeXL

NodeXL is a simple yet feature-rich add-in for multiple versions of MS Excel, including 2010, 2016, and 365, for the purpose of social network and content analysis. There are two versions, namely basic and pro, with the only difference being the number of features. The platform provides detailed documentation to help everyone start their own networks in no time.
One of the features of the add-in is Network Visualization which helps you to visualize the network graph, select from different layout algorithms, define the opacity, color, label, shape, and size of edges and vertices. Besides this is Social Network Analysis that allows you to group vertices by attributes or cluster, measure overall network metrics, and determine simple vertex metrics.
The extension also supports Data Import and Export. For import, you can use matrix, GraphML, UCINet, and Pajeck formats, while export can be done in MS Office PowerPoint, NodeXL maps and reports to Graph Gallery of NodeXL, and more. The best feature is that you can use Social Network APIs for Wikipedia, Twitter, YouTube, and 3rd Party Graph Data Importers. Lastly, it enables everyone to initiate different types of Content Analysis such as Time Series Analysis, Text Analysis, Time Series Analysis, and Sentiment Analysis.
#4 Pajek

Pajek is a lightweight solution developed from scratch by an extraordinary team of developers for the purpose of Large Network Analysis. It is compatible with multiple versions of Microsoft Windows, no matter whether they are x86 or x64, as it works exceptionally well on both of them. The license allows everyone to use it without paying a single penny as long as they would like but only for non-commercial use. Besides running it on Windows, you can also get it to work on any Linux system via Wine. The program has a simple UI with all the options laid out on the top bar.
#5 Centrifuge

Centrifuge is a complex and highly useful data analysis tool that allows for interactive data exploration. You can undergo a massive data discovery technology that offers flexibility and extensibility to connect and view data while not needing expensive services or sophisticated data transformation. The solution merges interactive visualizations, data connectivity, spatial awareness, and link-analysis to reduce the complexities of problem-solving and data understanding. Import your data from any source for the purpose of in-depth analysis.
Embed Python or R scripts to align with the data environment or security of your choice. One of the prominent features is in-depth link analysis which is utilized by top businesses and is open-ended, enabling you to connect entities. You can invest maximum time in useful insights than data prep, thanks to the availability of join tools or visual data. A special feature is a Broadcast, through which you will be able to find a defect in one view, magnify, and re-broadcast the data to available data visualizations.
#6 Commetrix

Commetrix is a rich software framework that is built to help you initiate Dynamic Network Analysis and Visualization. It has been functioning for 15 years and works best for Social Network Analysis. One specific use case in analyzing data for a certain period. You can use it without any cost for non-commercial use. It comes with a wide range of features and has comprehensive documentation put together to help you understand the built-in functionalities.
You can browse and analyze all types of social network data formatted in any supported format like .csv, .xml, .xls, or .sql. The data format may have relationship types or strengths, time stamps, variables, and contents/text. You can navigate across evolution and virtual community structures in electronic communication networks with great ease. Another great feature is performing analysis on dynamic network change, structures, properties, and lifecycles.
It also comes in handy for building recommendation systems or expert network maps from multiple network data sources or communication logs. You can explore, search, and filter social corpora such as discussions or email without hassle. It can be scaled to different sources of network data like Discussion, collaborative tasks on contents or electronic documents, Instant messaging, electronic project collaboration, and more.
#7 Cuttlefish

Cuttlefish is an open-source network workbench app that uses top-notch layout algorithms or visualizing networks. You can perform deeper visualization of various outputs and input methods in tex through PSTricks, and Tikz, network data, and graph edition and process visualization. The solution is made by a highly qualified Chair of Systems Design of ETH Zurich. This team is serving as a research group that implements a sophisticated system technique to investigate social and economic networks.
Cuttlefish represents visualization and network data information using the latest file formats, namely CXF and cef. The former defines network information such as weights, vertices, edges, and visualization details such as shapes, labels, and colors, while the latter is used for the purpose of reflecting the modifications occurring in a network.
#8 EgoNet
EgoNet is a comprehensive, easy-to-use, and highly resourceful Visualization tool that allows you to gather and run an analysis of egocentric network data. It comes in handy for a variety of use cases like building questionnaires, collecting and organizing data, and offering data matrixes and global network measures for performing more analysis using any other software tool. The software is available for usage by different stakeholders like students, researchers, and companies. There is no restrictive license attached to it, allowing you to achieve goals without problems. Lastly, it has a simple and user-friendly UI that you will become familiar with instantly.
#9 GraphChi

GraphChi is a robust program that is compatible with many major operating systems and is available as Open Source, unlocking a vast number of possibilities. You can use it to execute different operations like activity mapping and network monitoring on a big system from your computer. The solution lacks a proper GUI and works similar to a library backed by programming languages, enabling everyone to use this library in their work to access each and every feature offered in a typical network activity monitor. The supported Operating Systems include Linux and MS Windows.
#10 KeyLines Graph Visualization Toolkit

KeyLines is a cutting-edge Javascript Toolkit that simplifies the process of creating rich Graph Visualization products. It enables you to create custom applications for your audience and can operate on any modern browser such as Firefox, Chrome, Opera, and more. It can also be used on servers and databases and provides in-depth guides and demos to improve your understanding of its functionality.
The main purpose of KeyLines Graph Visualization Toolkit is to assist with the production of full-fledged graph visualization tools that can function anywhere. It is powered by HTML5 and WebGL technologies to optimize the experience of the audience. The toolkit provides various other advanced features that include Automatic graph layouts, Time-based & Social network analysis, Combine nodes and links, and geospatial analysis.
#11 Graphviz
Graphviz is an open-source graph visualization software that provides you with structural information. The software comes with all the necessary tools and services that make graphing functional with an in-depth analytical view. Many different graphs are available with in-depth knowledge of the program in multiple languages.
The software assists you in many sectors with its application: bioinformatics, software engineering, database, web design, and visual interfaces for various technical domains. The software is making its mark with its deep data analytics and documentation that serve you a path to know better development programs. The software features bugs and issues tracking in no time and provides you translation with multiple native languages.
This software makes its mark with its detailed diagrams with many options for color, fonts, tabular nodes, line style, hyperlinks, and custom shapes. Graphviz has many features to offer that include program layouts, simple text language, SVG for web pages, PDFs, interactive graph browsers, and much more. The software has many resources available that permit you to do better programming visualizations.
#12 Gephi

Gephi is an online graph visualization and exploration services providing software that allows developers to analyze programs more deeply. The software comes with all the tools and functions that make your programming effective and robust. This software is for all kinds of networks and graphs with the support of multiple languages.
The software is featuring with its multiple applications that are exploratory data analysis, link analysis, social analysis, biological network analysis, and poster creation. Gephi is making its mark with its in-depth documentation and resources that guide you on how to increase the effective running of the software and has an advanced technology feature that includes an ergonomic interface, native file formats with high performance.
Gephi is making its mark with its multiple features that are real-time visualization with detailed data, various layout algorithms, metrics, over-time networks, cartography creation, dynamic filtering with data, and table. In addition to data, it is offering spreadsheet import wizards, database import, and save or load of project files with extensible plug-in centers.
#13 Tom Sawyer Software

Tom Sawyer is a robust data visualization software that allows checking the performance of your products in no time. The software equipped with all the tools and services based on modern technologies that are helpful in compelling visualizations. The software is making its importance with its deep data analytics and multiple language support.
This software is featuring with its multiple designs of the graph and uses every toolkit to make interactive graphs with the complete range of colors, boxes, dots, and lines. Tom Sawyer comes with the entire integrated software based on leading data sources and standard formats. The software has in-depth documentation and resources that serve to increase the data reading ability with its guidance service.
Tom Sawyer has multiple products to offer that are graph database browsers, graph and data visualizer, business processor, and many more to add. The software is making its importance with its unusual solutions related to business demonstration, fraud detection, network topology, flow and impacts, link analysis, scientific visualization, and more to add.
#14 Dundas Data Visualization

Dundas Data Visualization is an online management and development platform that provides exclusive data visualizations that help users manage business expenses easily and comfortably. It provides an attractive and well-managed dashboard that provides valuable insights into various processes to generate perfect decisions. Users can make custom dashboards according to their desire to get wide visualizations, themes, or styles. It provides in-depth reporting on various business prospectuses and offers reports designing and special tools for Ad Hoc reporting. This platform leverages exclusive data visualizations through charts, gauges, maps, and diagrams.
Dundas Data Visualization offers integrations with ease, authentication, extensibility, multi-tenancy, and Microsoft Technology integration without any complex installations. It gives exclusive reporting on different prospectuses that help to increase business productivity and growth. Users can enjoy a safe and secure business platform with no data loss or fraud. Moreover, it gives advanced and precise data analytics for deeper insights into business expenses. This platform supports embedded BI that easily integrates into existing systems or applications.
#15 UMLGraph
UMLGraph is a professional automated drawing tool that allows designers to draw the declarative specification and drawing of UML class and sequence diagram. The features of UMLGraph are supported for all kinds of UML diagrams, generate high-quality diagrams, class diagrams system, support for various image formats including postscript and frame maker drawings.
It is designed to support all types of UML diagrams to ease the work of designers and programmers. Class diagrams and sequence diagrams are the specialized areas of the UMLGraph. It is a tool by using which designers can improve the layout of the class diagrams as well by merely manipulating the dor parameters ratio, nodes, and miles.
Users can even instruct the UMLGraph to include private fields in its output as well, and for this, they are first required to pass the –private flag to JavaDoc. In the same way, UMLGraph assists the diagram makers in keeping an eye over all of their activities.
#16 Lucidchart
Lucidchart is a cloud-based diagram and flows chart maker for quickly creating diagrams, UML sketches, flow charts, and ER models. It is the best platform for creating a professional-level flowchart, sharing creative work with others, and creating brainstorming diagrams for project management level diagrams and flowcharts.
It is cloud-based, which means no need to install any software or extension in order-making either online diagrams or flow charts. By deploying the online portal of Lucidchart, the designers can quickly develop the sketches and share the professional level of flowchart diagrams with other users as well.
The best about Lucidchart is that it is suitable for all level of professionals either it is about brainstorming or managing an entire project, Lucidchart support all type of diagrams and chart creating in addition to providing communication and team collaboration.
As it is integrated with collaborative technology, and secondly, it is designed on the technology of being compatible, so Lucidchart supports the other apps and programs like Google apps and full support for the Microsoft Visio Documents.
#17 draw.io

draw.io is a web-based diagram and flowcharts making software for making any flowcharts and diagrams. It is for creating graphs, organization charts, process diagrams, flow charts, ER, UML, and network diagrams. The best about it is that it allows the creators to store their word directly to the most popular cloud storage devices, including Google Drive, OneDrive, and Dropbox.
Moreover, the users can also save the work directly to storage devices and browsers. Being a multiplatform diagram and flow chart maker, the services of draw.io can access from any of the web browsers. Moreover, it deploys the technology of mxGraph that is itself based on the JavaScript Graph Visualization Component.
draw.io provides users with a single, consistent and complete set of API that lets the users easily create a consistent diagram or chart in any web-based environment. They are not required to worry about the version of any web browser. In addition to all these, draw.io is also integrated with the comprehensive features of editing, which lets users focus more on the project.
#18 Dia

Dia is a free and multiplatform software to draw structured diagrams. It supports over 30 types of diagrams and flowcharts, including network diagrams, network layouts, database models, flowcharts, and many others. Moreover, there are over thousands of objects are there in Dia that can be used by the designer at any time, and they are customizable too.
This application can be easily handled by various operating systems, including MS Windows, Mac, and Linux operating systems. Dia is an open-source and free application under the GNU license that lets designers modify the Dia according to their requirements easily.
Most of its features are much similar to that of MS Office Visio. However, the diagrams system of Dia is geared more towards comfortable to use tools as compared to the MS Office Visio. The best about Dia is the fact that it is a very little diagram application, but it can be used for different and many types of diagrams.
Moreover, it has its own independent set of diagrams and internal structure that lets the users of Dia quickly draw entire relationship diagrams, flowcharts, network diagrams, and a lot of other structured diagrams.
#19 yEd Graph Editor

yEd Graph Editor is for making high-quality diagrams and graphs within a few clicks. The free desktop version is available for Windows, Mac OS X, and Linux operating systems. yEd Graph Editor enables users to create diagrams manually as per their requirement and also import data and tools from their directory to creating the best diagrams and graphs.
It is up to the designers whether they want to go for the manual diagram creating or opt the importing of the existing one of the yEd Graph Editor; they will be here provided with both options. It is an application that is expert in instantly creating ULM diagrams, mind maps, organizational charts, and a lot of other tables and graphs range from development to educational purpose.
The four main features are the import of own data from Excel or any other XML format, user-friendly interface, automatically arranging of the elements of the diagrams, and all this end on the export of diagram in various formats from PNG to PDF and SWF. Talk about the diagrams that can be made through yEd Graph Editor; then these are BPMN diagrams, UML class diagrams, family trees, flowcharts, semantic networks, social networks, and many more.
#20 OmniGraffle

OmniGraffle is for creating stunning graphics, diagrams, flowcharts, electrical system design, family tree, mapping, and much more. It is available for iOS and Mac OS X. The features of OmniGraffle have documented synchronization, Graphviz layout system, artistic look, customs setting, custom templates, multi-page and documents, export option, unit scaling, resolution setting, and much more.
It is an application for creating almost all types of charts and diagrams if you are looking for a platform from where you can create website wireframes, electrical system design, mapping out of software classes, a family tree, and a lot of others.
For its stunning features, OmniGraffle can be said as a must-have diagram and chart making an application for artists, causal data-mappers, artists, and for all those who have to deal with simple to the sophisticated level of diagrams.
At OmniGraffle, they will be provided with an extensive range of options and tools like templates for ready-made work, canvases for both manual and ready-made work, stencils, and almost all those that assist designers in doing something quickly and outstanding.
Most of the features are common in both free and pro versions of the OmniGraffle, but expert and professional designers can easily understand the advantages of having the professional version. So, it is OmniGraffle that is the house of all features of the OmniGraffle from AppleScript & Actions Support to Tables, from Shape Combinations to Object Geometry Controls and many more.
#21 ArgoUML

ArgoUML is an open-source modeling and diagram creating application integrated with all features that support all types of standard UML 1.4 diagrams. It works from any Java platform and is available in almost ten other languages a well.
As it is a free and open-source UML modeling tool, so, users of ArgoUML can even modify their purpose as well to make their work even more accessible. If you talk about the features that will be at your disposal, then this list includes the various stunning features. Either it is about support for all nine UML 1.4 diagrams or click and go system, XMI support of export of pictures, advanced diagrams designing & zoom or OCL support, and reflection-in-action system or opportunistic design.
Every feature in ArgoUML has its specific purpose that lets the users get the best comprehension and problem-solving tools. Explorer perspectives system, and then the overlapping and multiple views are also part of the ArgoUML.
It delivers profile for Java, C++, and UML 1.4. The diagrams that are being supported by the ArgoUML are the class diagram, statechart diagram, activity diagram, use case, collaboration, deployment, and sequence diagram. Moreover, all diagrams come with adjustable font size, as well.
#22 UMLet

UMLet is a lightweight yet powerful and rapidly drawing UML diagram maker based in the Eclipse environment. It is an open-source program that means you can modify its internal structure as well according to the requirements of your project.
It is a diagram and chart maker that can be deployed quickly for instantly and efficiently drawing UML diagrams, activity diagrams from the plain text, building sequence diagrams, and even exporting diagrams in image format and PDF format.
The designers can also share their diagrams by efficiently using the Eclipse and can even create new and custom UML elements as well. The best about UMLet is that it is an independent and also a supported drawing making application that runs as a standalone and as an Eclipse plugin on three popular operating systems, mainly Windows, Linux, and OS X operating systems.
In previous versions of the UMLet, there were a lot of issues that were resulting in producing bad projects. However, the latest version of UMLet, in addition to improving itself, contains the new custom elements and new sequence system as well. Opaque elements, line, enhance relations, and a lot of other great tools are now part of the UMLet.
#23 Cytoscape

Cytoscape is an all-in-one platform that provides state-of-the-art tools to help you create diagrams of molecular interaction networks and merge them with attribute data like annotations and more. It was initially intended to serve biological researchers, but over time, evolved into a platform providing visualization and network analysis services.
Cytoscape offers many exciting features. It is compliant with many file formats like Gene Association, SIF, PSI-MI, XGMML, SBML, GML, OBO, and more. It can quickly link to open-source databases, annotation data, and import networks that include the NCBI Entrez Gene, Pathway Commons, BioMart, and more. The platform is continuously working to provide compatibility with more database services. Besides these characteristics, It allows you to export images in several formats such as BMP, JPEG, PDF, PNG, and SVG.
It offers extra features in the form of apps that can be downloaded for free from the Cytoscape App Store. Apps help with various tasks such as establishing a connection with databases, network & molecular analysis, scripting, and more. Developers can also design custom applications by using the Cytoscape API that uses the Java Programming Langauge.