Lisrel
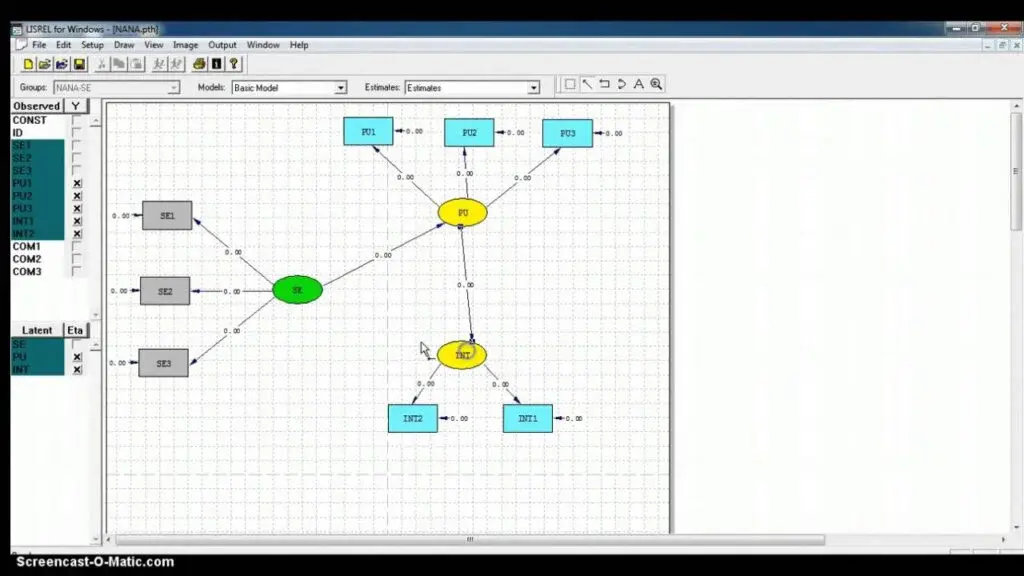
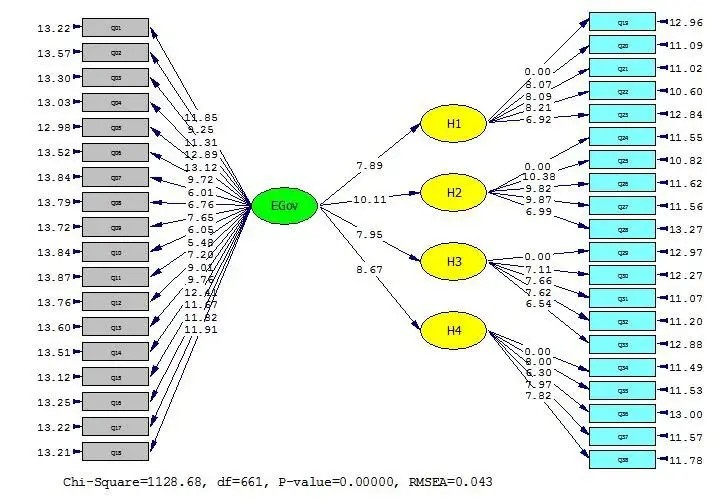
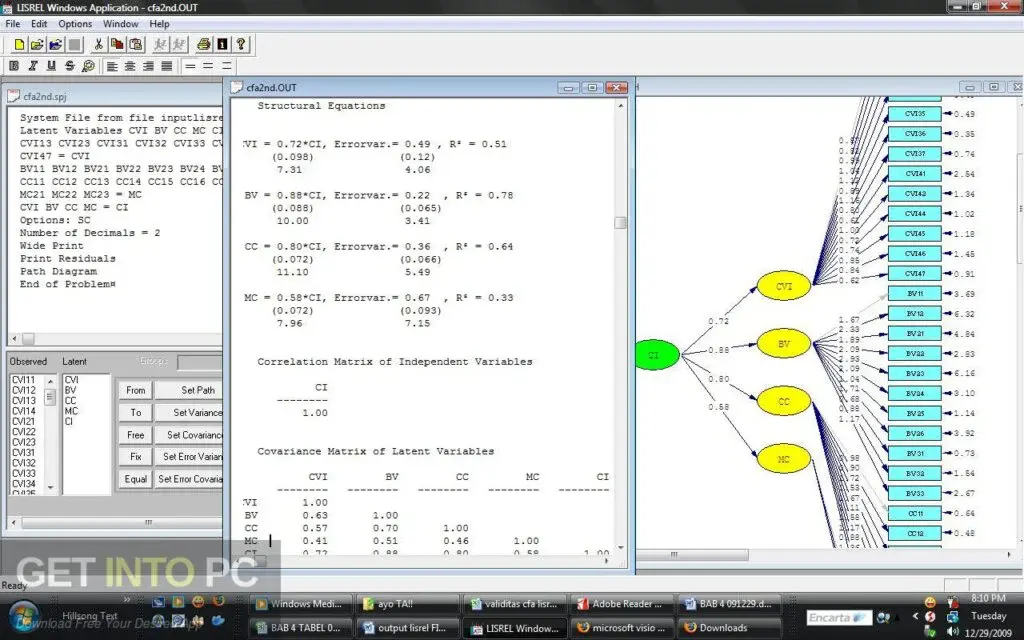
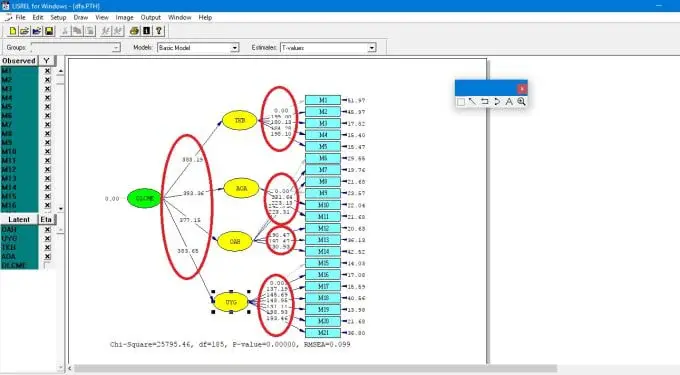
Lisrel is a scientific and statistical tool that provides the basic models and methods for structural equation modeling. This tool’s structural equation modeling system provides the users with the system of data management of almost all fields like social & management sciences, biological & behavioral sciences, and other professions to assess their respective models and theories. Most of the theories and models are mostly formulated as models for latent and observed variables. The latest version of this tool includes the various other statistical applications used for structural equation modeling, data manipulations, basic statistical analyses, generalized linear modeling, generalized linear modeling for multilevel data, and non-linear and hierarchical modeling.
It is the best choice for standard and multi-level structural equation modeling. Data manipulation to data generation and data transformation to logistic regression contains the solution for all types of statistical issues and data analysis. If you are looking for a statistical tool to control the complex survey designs, this is the one with a multilevel system to provide you with the control on multilevel linear and non-linear models to conduct the complex survey designs. The list of models in Lisrel for sampling distributions includes the multi-nomial, Bernoulli, binomial, and a few others.

Lisrel Alternatives
#1 GraphPad Prism

GraphPad Prism is a cross-platform graphical representation data platform that delivers the solution of analyzing, graphical representation, and presentation of data in two scientific formats. GraphPad Prism is equally useful for both educational purposes and large enterprises to view the understandable statistics of the organization.
It is a way to represent the data in a 2D graphing and statistical method. The main technical features of GraphPad Prism are mathematical comparison system, column statistics, linear regression & correlation, non-linear regression, clinical lab statistics, and many more. The availability of the unique system of analysis checklist allows the users to check the data for possible errors after finishing the data.
By this, the users can ensure the accuracy of the data. This system provides solutions for monitoring the independence of errors, unpairing of data, easily comparing two groups, nonparametric tests, and many others. Although it is designed for making the work easy and straightforward, it is basically for carrying on the sophisticated level of tasks. At the same time, the users can carry on multiple tasks, and all the parts of the work will be linked with each other.
#2 QuickCalcs

QuickCalcs is a combination of various calculators and statistical methods. The calculators available here can be used for categorical data, continuous data, statistical distributions & interpreting P values, random numbers, chemical & radio-chemical data, analyzing, etc. Move to its official website to access all these calculators and choose the one you want to use.
The categorical data calculator provides the users with the solution of Fisher’s, Chi-Square, McNemar’s, and NNT. Continuous data system contains the solution for descriptive statistics, detect outliner, multiple compression tests, and various other tests. Then comes the statistical distribution and P values interpretation system that is basically used to calculate the test values. In short, all these scientific calculators are best for data analysis and provide the users with the best system for creating and converting even molar solutions and performing various other functions.
#3 Tableau Desktop

Tableau Desktop is a data visualization platform for the graphical representation of data and getting an in-depth sight of the business within few minutes. It contains almost all those tools and instruments that provide the business owners with the complete business solution of complex data issues. It is one of the best data representers and analyzers that keeps the work inflow. It is an easy and simple to use platform integrated with a hundred times faster solution for almost all business problems regarding data representation.
The drag and drop system makes it easy for the users to leverage their business skills and get the best possible output from the analytics and graphs reporting tools. Either user are working in an SQL database, spreadsheet, or in Hadoop, it will provide them with the system of connecting all these at a centralized platform. At last, there is a sharing system for better team collaboration and a perfect data-guided decision-making system.
#4 Analytica

Analytica is the alternate of old and traditional spreadsheets and data representations used to build and represent the business models. The easy-to-use formation system enables businessmen, designers, and developers to easily create the models they are thinking about. They can even collaborate with the other team members by utilizing the communication tools. It is a platform that is used for creating, analyzing, and communicating quantitative decision models. It is also used for decision making, information visualization, numerical analysis, etc.
Its independent system named Monte Carlo enables the users to quickly evaluate risk and uncertainty and find out the solution for the variable data. It is one of the best visual software that provides an intuitive environment for creating, exploring, and sharing quantitative models. The main highlighted features of Analytica are diagram, model hierarchy, flexibility, solution for risk & uncertainty, fast execution & development, highly optimized, sharing system, elegant integration with the other tools and databases as well.
#5 R Project

R Project is a platform for statistical computing to explore the datasets and convert any text-based data into graphs. It is a freeware application for statistical graphing and computing. It is a multiplatform application that runs on UNIX-based operating systems, Windows, and Mac. It contains the language and environment for graphics to access certain system functions. It is capable of running any program that is stored in the script files. R Project is useful for the data miners and statisticians for building the data analysis and statistical software.
It combines the features of the S programming language along with the lexical scoping. It is integrated with an extensive range of graphical and statistical features alongside classical statistical tests, time-series analyses, classification, nonlinear modeling, and linear modeling. The best about the R Project is that the R-Project instruments can be extended more via third-party extensions and functions in addition to all these statistical features. R Project is not about statistical features; it has the programming solution and provides the dozens of programming features in a command-line interpreter’s shape.
#6 GenStat

GenStat is a statistical and data analyzing tool that basically packs multiple statistic tools and packages. It delivers the users a simple platform that is further integrated with a comprehensive system reinforced with a sophisticated programming language. It performs two basic functions of data analysis and statistical representation.
However, both types of users will be provided with an easy-to-use menu-based interface and a powerful, flexible system to organize the work throughout the project. Its command language interface will support all this process. The best part about it is the availability of an extensive range of statistical and data analyzing techniques that professional statisticians have designed. The list of features included in the solution for basic statistics, analysis of designed experiments, linear mixed models, microarray analysis, spatial analysis, time series, statistical process & control methods, survival analysis, and many others.
#7 OriginLab
OriginLab is a data analysis tool that provides the engineers and scientists with the technical charts and system for 2D and 3D plotting and all kind of fitting, including curve and peak fitting. OriginLab is one of the best data and scientific analyzing platforms used for all sorts of statistical representations of data.
OriginLab is tailored with the requirements of the engineers and scientist that delivers the easy to use interface and the ability for advanced users to customize the graphing. OriginLab provides highly customized and configurable themes, custom reports, templates, and even programming and batch processing.
First of all, there is a proper system of workbooks, note-taking, and graphs making that will reduce your dependency on the traditional spreadsheet platform. The single workbook of OriginLab provides almost ninety million rows and seventy thousand columns.
The users can even add embedded or floating graphs in their work as well. The custom reports and analysis templates of OriginLab provide the users with a comprehensive system for automating repetitive tasks. There are almost a hundred plus graphs in the OriginLab that allow the users to create quality graphs according to the data requirement.
#8 Maple

Maple is a technical computing and statistic software designed for engineers and mathematicians to perform data analyzing and analytic functions. It is integrated with the technical features and solutions of symbolic computation and provides various other solutions for engineering. It is a way to reduce the development risk and ensure better products. It combines the features that make it easy for the users to analyze, explore, and visualize the mathematical problems.
This tool is a method to organize multiple projects and apps by using intuitive workbooks. The main highlighted features of this tool are a system for performing the new operations, solve all kinds of mathematical problems, availability of intuitive & flexible data frames, system for creating the complex level of interactive apps, perform calculations with the thermophysical system, statistical analysis, and visualization tools.
#9 SigmaPlot
SigmaPlot is a graphing and scientific data analyzer that contains the solution of the basic graphing needs of the users. It is a graphing, statistic, and scientific data analyzer for creating exact graphs quickly and easily. The advantages of using SigmaPlot are that they quickly create exact graphs, easy data visualization, publish charts & graphs anywhere, data analysis, etc.
SigmaPlot works beyond a simple spreadsheet system and assists the users in précising their work. It assists the users in creating high-quality graphs within minutes instead of spending unlimited hours in front of traditional data analyzing platforms. SigmaPlot integrates the most of the features of MS Office as well that lets the users to easily access their data from the MS Excel spreadsheets and workbooks and present them even in the form of presentation in the MS PowerPoint.
SigmaPlot is one step advanced as compared to the SigmaPlot as it offers the most advanced graphs and publication-quality charts. It provides users with more options for modeling, graphing, and charting from simple to complex technical data as compared to the other graphics software.
#10 Xlstat
Xlstat is a tool to get the perfect data analysis in MS Excel. It is a standalone system and widely used data application integrated as an add-in for MS Excel. Being a cross-platform application, it can be used for both Windows and Mac OS X operating systems. The three main advantages are the availability of intuitive statistical and data analyzing environment, easy integration into MS Excel, and the availability of almost two hundred features.
All versions of Xlstat provide the essential statistical functionalities and tools designed according to the needs of the users. The core highlighted features are a user-friendly system for getting a grip on scientific work, solutions for almost all fields, availability in multiple international languages, availability of dialog boxes to organize data analysis and interpretation of results, and support for both automation customization.
#11 Pathomx
Pathomx is a graphing and data analyzing tool for the analysis process with interactive data workflows. Its drag and drop and multivariate analyzing tools allow the users to speed up their analysis with the data workflows system based on Python. It is especially for the scientist and engineers by using which they can get and access open-source, custom tools and scripts. It is one of the best workflow-based analyzing platforms that deliver high-quality analytical tools to the users that maximize usability.
It is a free and open-source tool for the scientist that the professional scientist creates. It lets the users create simple to complex analysis workflows, including the univariate and multivariate through the simple to drag and drop interface. The tools and features available here are highly customizable and configurable and let the users instantly create and finish any project and immediately analyze the result. The prototype scripts created via Pathomx can be export or share with other users as well. Drag & drop analysis, multivariate analysis, pathway visualization, and custom scripting are the four basic advantages that can be accessed using this platform.
#12 NCSS

NCSS is one of the best statistical software to get the comprehensive, easy-to-understand graphics and output of any text and numerical data. It is a computer application for statistical and data analysis. It includes over 230 documented statistical and plot procedures. The best thing about it is that it exports and imports almost all major databases, spreadsheets, and statistical file formats. It is a robust yet easy-to-use graphics and statistical program that can be used by academia, medical research, and business research purpose.
It delivers the users a system of easy-to-use and highly customizable graphics and statistical tools that easily visualize and analyze the data. It is not only about analyzing as it offers the users an advanced data management system to explore the advanced level of features to manage all data types. It comes with the basic solutions and integration of advanced level of documentation. Either you are a researcher or business professional, within few steps, you can get meaningful and reliable numeric results and easy-to-understand graphics.
#13 InStat

InStat is an amazing statistical program that is designed for sports management. It integrates the basic features of statistical jargon and a data analyzing system that lets the users analyze the data in various formats within few minutes. The five main advantages are a step-by-step guide to start the statistical analyzing process, clear analysis choices, explanations, easy-to-understand results, and a unique style of analysis checklists to reconcile the data.
A proper analysis checklist on this platform is known as the reconciliation system to verify data. It delivers a double-check system to verify the data that has not violated any of the assumptions set by the users. This system lets the users select that test aligned with the experimental design set by the users.
#14 Stata
Stata is a professional level of statistical program for the professional integrated with the basic statistics packages and data management tools. Stata is not a single data analyzing tool; it is the set of the various graphs and statistical data representation tools based on the need of the users. Any discipline can use it, then be it is behavioral sciences, educational institutes, medicine industry, public policy, biostatistics, epidemiology, public health, or any other.
Stata is the giant house of unlimited features in which many may be common for you, but dozens will surely be new for you. The best about these features is that these further opened into other categories make it easy for the users to go with any of them. The ultimate aim of all these features is to make the work of users simple and easy.
The main highlighted features are the availability of all kinds of linear models, time series, data management system, survival analysis, and availability of unlimited graphics. It also offers multilevel mixed-effects models, power & sample size system, statistics tools, treatment effects, statistical methods, and dozens of others.
#15 StatSoft Statistica
StatSoft Statistica is a highly comprehensive data management suite for dealing with a large set of data and getting the statistical analysis. It is not just a statistical analysis, but it also works as simple as using a predictive analytics platform that presents an in-depth picture of the data. It allows the users to embed the analytics results. Using this tool, the users will get the advantages of embedding analytics, empowering the people, and accelerating the innovation in the organization’s internal environment.
The first and utmost purpose of any data analysis and statistical analyzing tool is to provide the users with the system of making the best decisions at the perfect time. So, this is what this tool provides as the real-time picture of the business providing the users with the system of making the right decisions. Using the StatSoft Statistica, the businessman can easily predict, plan and anticipate the quality issues at the right time that they had never before.
#16 JMP

JMP is a data representation tool that empowers engineers, mathematicians, and scientists to explore any data visually. From a single purpose to meeting the specific requirements, this tool contains the solution for all. It is a method to find unexpected results by utilizing highly advanced features like data acquisitions, data cleanup, data visualization, basic data analysis system, filter & subset of data, design of experiments, statistical modeling, what-if analysis, sharing of results, and dozens of others.
The above-mentioned features of JMP are enough to tell that what it can do for its users. You can either use it for reliability analysis or consumer and market research because it will never let you down. The best about JMP is that it permits the users to start from any data format and then get the output in any other desired one.
#17 Wabbitemu

Wabbitemu is an accurate emulator for Texas Instruments-based calculators TI-73 to TI-86. The most popular emulator for the Z80 calculator offers animated screenshots, keystroke logging and save states, etc. It is available to use on multiple platforms such as Microsoft Windows, Mac, Android, etc. This software requires a ROM image.
Wabbitemu includes an easy-to-use setup wizard that will help you to create a ROM image for your TI. It is one of the best and easy-to-understand software. After the installation, you need to bring up the menu by clicking the left edge of the screen. One of the best and most interesting things about this software is that it offers a customization option to change emulator settings to improve your working experience.
#18 SPSS

SPSS is an all one small statistical package that allows you for interactive, batched, or statistical analysis of the data. The software is dispensing a broad range of analytical tools based on nimble technological functions that pave the way for the exceptional statistical analysis. The statistical platform is facilitating you with a robust business and research solution via ad-hoc analysis and hypothesis testing. SPSS is advancing with the analysis of the survey data that allows the research agencies to get the most out of it.
The software is revolutionized its name via dispensing modern features that are a vast library of machine learning algorithms, open-source extensibility, text analysis, seamless deployment into the applications, and big data analysis. SPPS is highly flexible and scalable that is accessible for users of all skill levels and is suitable for the analysis of the projects involving complex data. The software is a time-saving option for organizations that permits them to find new opportunities for vast data analysis that, in turn, minimize the risk and enhance efficiency.