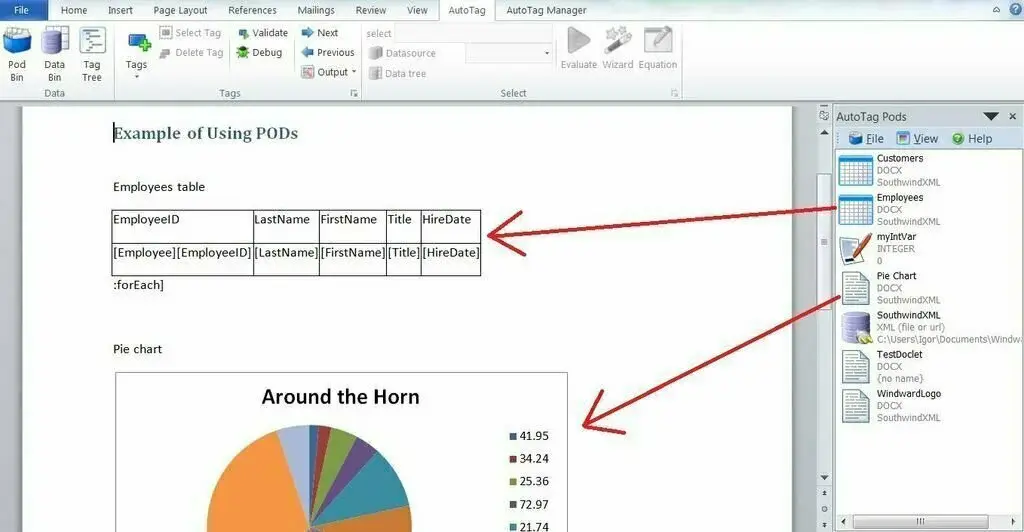
Windward AutoTag
Windward AutoTag is free for personal reporting and designing tools for individual and business purposes. It is also known as AutoTag Report Builder used to report writing and document generation tool that enables the developers and programmers to design, format and edit all type of reports in MS Office with AutoTag for Word and AutoTag for Excel.
It automatically adds to the MS Word and Excel as a ribbon and then enables the users to link their documents and spreadsheets to any data source. Windward AutoTag is equally best for the business professional, and enterprises that need a single report got more sources.
Windward AutoTag is the perfect way to generate reports and documents according to their liking. It is for those users who have to spend much of their time on copy and paste. By using the Windward AutoTag, there will be no more requirement of copy past as it will make you able to perform struggle free tasks.
For those who want to get an instant professional level of reports to represent their core business ideas must use the Windward AutoTag as from easiness to functionality. It will provide them with all those tools and instruments that are regarded as must-have elements for a professional level of reports or documents. It even allows users to connect with multiple data sources and carry on all tasks at once.
Windward AutoTag Alternatives
#1 Crystal Reports

Crystal Reports is a tool for creating dynamic presentations and reports. The reports can be made in up to 24 international languages, and the best about it is that it almost turns any data into an interactive report that can be accessed online offline, from applications, web portals, and mobile devices.
The other features of Crystal Reports include flexible & customizable, mobile interactivity, powerful report delivery options, support for MS Excel, broad data connectivity, etc. Crystal Reports is an all-in-one business intelligence software to create reports by utilizing robust and professional reporting tools that come with the support of various data sources.
The interactive features of Crystal Reports can be accessed in both online and offline environments and from almost every device and operating system. Crystal Reports provide more straightforward and more comfortable to understand databases and formats as compared to traditional data sheets and reports. It works best with other data sources as well and never destroys the database format or setting. It can be used as both stand-alone and also in collaboration with others.
#2 GridGain In-Memory Data Fabric
GridGain In-Memory Data Fabric is a productivity tool that delivers unprecedented speed and ultimate scale at blazing speed. It provides users with the best tools for creating an in-depth insight into any business or enterprise.
It provides high-performance processing, real-time streaming, and fast analytics in an all-in-one and full data access and processing layer. It is best for existing and new applications. The technical features of GridGain In-Memory Data Fabric are data grid, compute grid, service grid, data structures, file system, advanced clustering, streaming, Hadoop acceleration, etc.
The four primary areas of services of GridGain In-Memory Data Fabric is data grid, clustering & computer grid, streaming, and Hadoop acceleration. First of all, there is a data grid that provides the nodes adding a facility in real-time.
Then comes the clustering & compute grid that provides the best computing and transaction on a large-scale system for large data sets. At number three, there is real-time streaming that makes it easy for users to manage all of their work around a single use case through streaming data querying.
At last, there is Hadoop acceleration that features a dual-mode system and allows users to use it as a standalone file system or integrated with other files systems. In short, from integration to collaboration, GridGain In-Memory Data Fabric provides the all necessary instruments.
#3 Pentaho Community Edition

Pentaho Community Edition is the solution for small to large enterprises that contain the basic solution of reporting, data representation, analysis, and various other features that save them time and money of the business.
In addition to availing all these features, users of Pentaho Community Edition from the official website can explore for BA server and PDI marketplace entries as well.
Pentaho Community Edition is the way to give a new digital look to all of your data and managing the workflow all the time in real-time. Pentaho Community Edition is an all-in-one suite that includes ETL, analysis tools, metadata, and reporting capabilities.
With Pentaho Community Edition, a user can browse via the BA Server and PDI. The technical features are the latest PDI, submission of plugins, Ctools supports for Require.js in CDF/CDE, named Hadoop clusters, AWS EMR Shim support, spark integration, localization for Pentaho User Console, MongoDB, etc.
Pentaho Community Edition is the smartest way to put big data to work. It is a way to manage the complicated things and assigning them a proper order where users could get the information about any part like a to choose a pick.
In addition to providing the basic features and functions of reporting capabilities, Pentaho Community Edition provides various other third party installation packages as well to extend the functionalities of the Pentaho Community Edition.
#4 JasperReports

JasperReports is a Java-based reporting and analytics platform for developers, designers, and webmasters from where they can access the graphical designing tool of the JasperReports. JasperReports is one of the best open-source reporting engines written in Java.
It can use data arriving from any data source and generate pixel-perfect documents that can be viewed, printed, or exported in various document formats, including HTML, PDF, Excel, OpenOffice, and MS Word.
JasperReports’ core features are interactive report viewing & formatting, secure central repository, report scheduling & distribution, analytics for relational and non-relational data, etc. The best about JasperReports is that it works as a standalone server and an embeddable reporting server.
It is up to users either to use it as a standalone primary server or embed it with other data sources to explore the more features and functions of the JasperReports. JasperReports is available in two versions, mainly JasperReports Community Edition and JasperReports Commercial Edition.
Both versions provide the basic features of report viewing and formatting. However, to access the web-based ad-hoc report designer, analytics system, metadata layer, and a dashboard, users must go to the JasperReports Commercial Edition.
#5 Ubiq

Ubiq is an online business intelligence platform that is primarily used for visualization and analyzing of data and reports. Ubiq is a reporting and analyzing platform for MySQL and PostgreSQL.
The main advantages and benefits of using Ubiq are the availability of a user-friendly dashboard, easy creation of reports and even dashboard, data analyzing system, drag and drop feature, availability of system of filters and functions, team collaboration for sharing purpose and support for all type of data sources either local, remote or cloud.
It allows the developers to create reports easily, dashboards, analyze data using drag & drop, apply powerful filters & functions, share stories with others, and many more. Ubiq makes it simple for the developers, designers, and even the business owners to quickly analyze their business data.
By using the techniques and instruments of Ubiq, users can quickly generate web-based reports and dashboards. It delivers advanced reporting capabilities to create custom reports and dashboards for enterprises.
Users can even export the reports and dashboard in multiple formats as well and can share the same with other team members. There is no need to upload the data Ubiq supports the drag and drop feature that saves the time of users.
#6 Aspose.Total for Reporting Services

Aspose.Total for Reporting Services is a reporting platform, specially designed for the MySQL Server developers. It provides these developers with basic developing, programming, reports generating, and analyzing tools to make their work easy and straightforward.
Aspose.Total for Reporting Services is a pack of five unique rendering extensions for MS SQL Server reporting services. It delivers native Excel reports in MS SQL Server 2002 to 2014 Reporting Services and also in MS Report Viewer 2005 and 2008.
Aspose.Total for Reporting Services allows users to export all of their RDL reports in various other formats, including the MS Office, PDF, and text documents. It also delivers the option of adding barcodes to the exported documents, as well.
It is a powerful reporting solution for those developers that are at an initial stage of developing. By using the Aspose.Total for Reporting Services that can quickly create an extensive research and development project.
It offers the developers with those reporting services that make them able to be more productive and deliver quality services to the others. Aspose.Total for Reporting Services provides services to all types of users. Either these are banks, education institutes, government organizations, legal institutions, or any other kind of company.
#7 Valentina Reports
Valentina Reports is a reporting engine and set of embeddable applications for the various platforms. It offers users a lot of reports that can easily be embedded in any of the online and offline applications. In addition to providing the ready to use reports, Valentina Reports delivers users with the system of creating stories as well.
The software is known as a royalty-free reporting system that lets users freely utilize the powerful and graphically rich reports and embed the same in any of their applications.
The six main features of Valentina Reports are native database support for document & report generation, interfaces with the applications of the users, scalable to the server, visual builder, document generation, and, at last, it is royalty-free.
If you want the support of significant databases like MySQL, MS SQL Server, SQLite, MariaDB, and Postgre at one place, then Valentina Reports is the answer to your search that delivers the support of native database at a single platform. The availability of significant and essential development tool in the Valentina Reports make it easy for the users to use the Valentina Reports from any device and operating system.
#8 ASP.NET Maker
ASP.NET Maker is a professional level of a report-creating tool designed for creating a dynamic level of web pages along with the support of native databases like MS Access or any other. It provides users with industry-level reporting and data generating tools that make it easy for users to instantly create detail and summary reports or even the crosstab reports for their websites.
From JavaScript charts to Flash charts, ASP.NET Maker provides the solution for all. There is no more requirement of client-side control as the scripts generated via ASP.NET Maker are free from all these formalities and come in a final useable position.
The flexible set of options and tools allow users of ASP.NET Maker to generate reports according to their custom requirements. Most of the reporting tools don’t provide a clean environment for reporting, and the best thing about ASP.NET Maker is that the codes generated via ASP.NET Maker always remain easy to understand and customizable. Both beginners and professionals can gain a lot from ASP.NET Maker.
#9 Telerik Reporting
Telerik Reporting is a reporting engine for HTML5, ASP, .NET, Ajax, Mobile, Touch, WinForms, etc. that provides report viewers for all these platforms. It is an interactive ad-hoc reporting for mobile, web, and desktop applications.
The key features of Telerik Reporting include delivering reports to any application, OLAP data engine and data binding, style reports according to the need of users, and creating interactive ad-hoc reports. The main advantages are that it is integrated with almost all those features and tools that assist users in creating intuitive reports for individual or commercial purposes.
The best part of Telerik Reporting is that it offers visual studio report designer, interactivity, map, chart, barcode, mail merge, and a lot of others. After creating the reports, the work can be export to other file formats as well, in which most popular are MS Excel, MS Word, MS PowerPoint, images, and few others. The other thing about Telerik Reporting is that it supports the various data sources as well.
#10 i-net Clear Reports
i-net Clear Reports is designed to meet the requirements of reporting. It is best for department managers, report designers, developers, and administrators. i-net Clear Reports is a visual report designer and is free to use.
The other best feature is that its design and run the report on any platform, utilize various layout elements in stories and visualize data from any JDBC data source, and many more. i-net Clear Reports is a fast and efficient reporting platform for every king of the user.
It is a way to design customized reports and run them on any platform and device. The report creating features of i-net Clear Reports allow users to make the use and meaning full reports. From simple to complex, i-net Clear Reports provide the solution for all.
In addition to providing the own set of databases, i-net Clear Reports can be used with the external applications servers as well, including IBM WebSphere, JBoss, and various others. Users of i-net Clear Reports even allow integrating into almost every Java-based application.
The other best feature is its remote interface system that is primarily for the administrators. They can easily configure the i-net Clear Reports in a case of non-availability of direct access to the server.
#11 Simple Reports
Simple Reports is a simple report generator for creating a variety of professional reports. It offers developers and designers a standalone dashboard to create reports and data queries.
It is a powerful platform to handle the varied and mix data sources at once. Making the ad-hoc reports via Simple Reports is very simple and easy. Simple Reports is not only about creating simple reports, but it allows users to create and design professional and attractive reports as well.
After making the reports, the users can embed the data into reports as well by using very few options. It also offers users with the system of HTML previewing and printing that make it better than others.
With the help of this solution, users can also create the sales statistics, warehouse inventory records, medical service trends, and all those where users are required to manage the lengthy and complicated nature of data.
The database management system of Simple Reports make it easy for the users to extract the essential information from the complex and bulk of information and presents them in an easy-to-understandable environment. Creating independent application reports via Simple Reports is also possible and comfortable too.
#12 SharpDevelop Reports
SharpDevelop Reports is a cross-platform.NET reporting solution for the Windows and web-based apps. In addition to providing the own servers and databases for report generating and document management, SharpDevelop Reports offer users with the support of few native databases as well.
The reports generated via SharpDevelop Reports can be print directly or can be export to PDF formats. Its model of SharpDevelop Reports for generating reports is using the Push Data Model that is for creating the reports from .xsd files. The other model available for making reports is using the Pull Data Model with the support of Stored Procedures.
This model is to start creating reports from the already designed reports of the SharpDevelop Reports. The three stories making the model of the SharpDevelop Reports make it easy and straightforward for the users to go for anyone and instantly start the report making.
#13 Microsoft SQL Server Reporting Services
Microsoft SQL Server Reporting Services is a server-based reporting service by Microsoft. It supports the enterprise level of reporting and documentation and offers a way to organize business data and get more in-depth analyses. It is a way to get the best output from the complex data.
Just like its database management system, SQL Server Reporting Services delivers users with clear choices to manage their data. The three main benefits of using Microsoft SQL Server Reporting Services are a high level of performance, a platform for hybrid cloud, and faster insights of data.
The new tools in SQL Server make it easy for the users to control more on the build patching and backup the data to tackle the disaster issues. The SQL Server databases of SQL Server Reporting Services allow users to take the advantages of exploring their skills.
Microsoft SQL Server Reporting Services is the platform of easy and ready to use tools that can be used for simple report creating to report designing. Use the SQL Server Reporting Services and take the advantages of a professional level of graphics, tabular, and variety of data to create reports of almost all formats.
#14 ActiveReports
ActiveReports is a .NET reporting platform designed for viewing the modern-day business requirements. It allows users to create all type of reports with the Visual Studio designing features and components of the ActiveReports that comes with an extensive range of API as well.
The best is that to providing users with the system of creating reports, it also delivers to them with the various type of forms and reports as well that are royalty-free. These are WinForms, ASP.NET, and HTML based. It also offers the free report server as well.
ActiveReports is the excellent collection of .NET reporting components and API that comes with an extensive range of code library and provide the complete set of reporting controls to users as well.
The features and built-in controls that are the part of the ActiveReports are tables, barcodes, data bars, sparklines, and maps to visualize the data. Users can script their requirements as well via the comprehensive database supports of the ActiveReports.
Then comes the multi-platform reports viewing system of ActiveReports that allow users to embed the customizable reports in their apps and even export them all in other formats as well.
#15 DevExpress
DevExpress is a reporting platform for the .NET Framework to transmit critical information through the business environment. It is a simple and easy way to demonstrate the complex information to make the best decisions and provide an intuitive reporting solution across the organization.
The highly customized features of DevExpress delivers exceptional performance to users. These customization features of DevExpress then provide users with a set of enhanced report controls along with multi-dimensional pivot tables and charts system to create the reports and presentations of unmatched informational clarity.
The high level of integrated features in the DevExpress reports merging, appearance customization, user-friendly dashboard, side by side reports system, master-detail reports system, sub reports, drill-down reports, multi-column reports, document maps and many more. Use DevExpress and deliver the data in a more systemized way that makes it easy for both managers and employees to get the real insight into the business in a more clear way.